File:Histogram Tmean S Baseline2 Gaussfit.png
Jump to navigation
Jump to search

Size of this preview: 559 × 600 pixels. Other resolution: 700 × 751 pixels.
Original file (700 × 751 pixels, file size: 23 KB, MIME type: image/png)
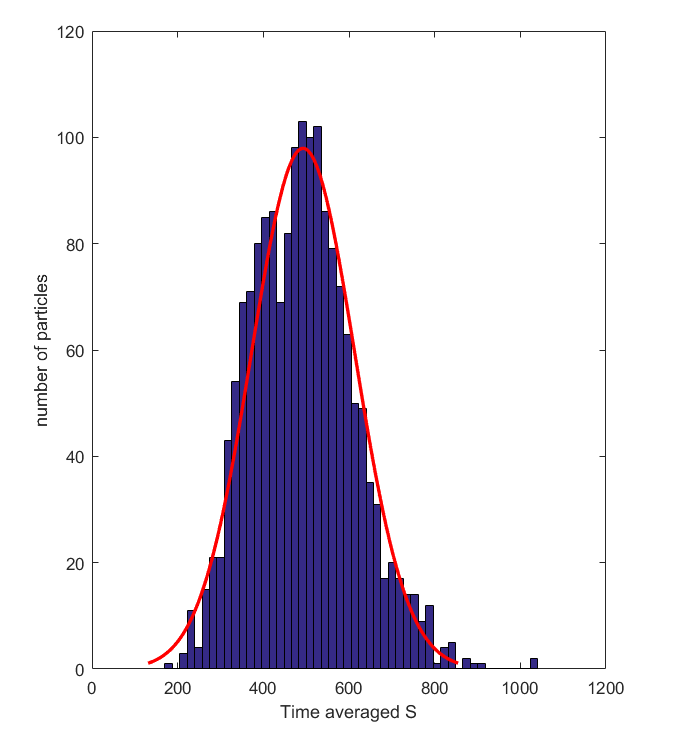
Histogram of the time-averaged measured suspicious score measured from the baseline video. A Gaussian distribution was fitted over the data.
File history
Click on a date/time to view the file as it appeared at that time.
| Date/Time | Thumbnail | Dimensions | User | Comment | |
|---|---|---|---|---|---|
| current | 16:29, 20 June 2017 | | 700 × 751 (23 KB) | S145431 (talk | contribs) | Histogram of the time-averaged measured suspicious score measured from the baseline video. A Gaussian distribution was fitted over the data. |
You cannot overwrite this file.
File usage
The following page uses this file: