PRE2018 4 Group7: Difference between revisions
| (43 intermediate revisions by 2 users not shown) | |||
| Line 62: | Line 62: | ||
=== Society === | === Society === | ||
It is well known that because of CO2-emission and traffic jams, society would benefit if people use more public transport. However, a huge problem with this in the Netherlands is that the NS currently has a bad reputation | It is well known that because of CO2-emission and traffic jams, society would benefit if people use more public transport. However, a huge problem with this in the Netherlands is that the NS currently has a bad reputation [https://www.businessinsider.nl/ns-werkt-hard-aan-zijn-reputatie-maar-er-zijn-weinig-organisaties-waar-nederlanders-zo-graag-afgeven/]. One of the ways they hope to improve their reputation is by improving passenger comfort. Our system can help the NS improve on this matter, which in turn would attract more passengers and will benefit society by extention. | ||
=== Enterprise === | === Enterprise === | ||
Enterprises | Enterprises should also profit from this new technology. Fewer irritated travelers will complain, providing a better image for train operators such as NS (Nederlandse Spoorwegen) or DB (DeutscheBahn). Next to that, with a better spread of passengers, the amount of carriages of a train can be optimized/minimized, leading to lower costs for these public transport companies. | ||
In particular, the NS is trying to work on their reputation, and one of the ways they try improve it is by improving passenger comfort | In particular, the NS is trying to work on their reputation, and one of the ways they try improve it is by improving passenger comfort [https://www.businessinsider.nl/ns-werkt-hard-aan-zijn-reputatie-maar-er-zijn-weinig-organisaties-waar-nederlanders-zo-graag-afgeven/]. Because of this the NS would also profit if the passengers can sit without walking through the train. | ||
Also in our consideration are the software and system developers. More technology in the train means that they have more work, leading to a higher revenue for these companies. Next to this, improvements on the platform also have an influence on Prorail, which manages the platforms. These platforms could be designed in a better way, leading to a higher train density at stations located in more densely populated environments. | Also in our consideration are the software and system developers. More technology in the train means that they have more work, leading to a higher revenue for these companies. Next to this, improvements on the platform also have an influence on Prorail, which manages the platforms. These platforms could be designed in a better way, leading to a higher train density at stations located in more densely populated environments. | ||
| Line 82: | Line 82: | ||
'''Sophie:''' | '''Sophie:''' | ||
Sophie is 16 years old. Each Saturday she travels by train from Geldrop to Eindhoven to go play hockey. Sophie has Protonopia (color-blindness). Therefore she can not use the app of the NS in its current state. Sophie thinks that the NS should design their app in such a way that people with visual impairments can still benefit from it. | Sophie is 16 years old. Each Saturday she travels by train from Geldrop to Eindhoven to go play hockey. Sophie has Protonopia (color-blindness). Therefore she can not use the app of the NS in its current state, since she cannot distinguish between the different collors used in the app. Sophie thinks that the NS should design their app in such a way that people with visual impairments can still benefit from it or at least give other alternatives. | ||
== Approach, milestones and deliverables == | == Approach, milestones and deliverables == | ||
'''Approach'''<br \> | '''Approach'''<br \> | ||
The problem will be divided into two subproblems. A counting system and a user interface. The counting system has to accurately count to amount of people in each compartment and compare it with the available space to get the information about the available space. For this, nowadays | The problem will be divided into two subproblems. A counting system and a user interface. The counting system has to accurately count to amount of people in each compartment and compare it with the available space to get the information about the available space. For this, nowadays weighbridges are used. However, we want to provide real-time data, since there is much activity around arrival or departure in a train. The user interface has to pass the information on to the passengers in a clear and understandable way. This user interface will consist of tiles that can have different colors or an LED screen providing information. Next to the tiles at the platform, an integrated app which also will be shown inside the trains will be developed. Combining both should provide the best possible solution for the problem of overcrowded train compartments and ineffective use of space.<br \> | ||
'''Milestones'''<br \> | '''Milestones'''<br \> | ||
The first milestone is finding out which counting technique will be used. When this is known, the basic layout for the app can be made. Also the basic layout for the physical system can get designed then. Second milestone is writing the code and checking if it works, by applying different test cases. In the meantime, the counting system can be completely designed and constructed. Merging these two systems is the next milestone. Coupling this data to NS' live data will be the last milestone. | The first milestone is finding out which counting technique will be used. When this is known, the basic layout for the app can be made. Also the basic layout for the physical system can get designed then. Second milestone is writing the code and checking if it works, by applying different test cases. In the meantime, the counting system can be completely designed and constructed. Merging these two systems is the next milestone. Coupling this data to NS' live data will be the last milestone. | ||
'''Deliverables'''<br \> | '''Deliverables'''<br \> | ||
The deliverables at the end of the project will be a design for a real-time system that accurately counts the amount of people in each compartment | The deliverables at the end of the project will be a design for a real-time system that accurately counts the amount of people in each compartment and a user interface that passes information onwards to the passengers as effectively as possible. Both parts will be combined to make a total system that gets accurate information about the occupation of each compartment and passes it onwards to the passengers through a straightforward user interface within the train, at the platform and in the app. | ||
== Questionnaire (Customer needs) == | == Questionnaire (Customer needs) == | ||
===Scope of the questionnaire === | ===Scope of the questionnaire === | ||
To get a grip on the customer needs for the concept which helps people to board a train more uniformly, a questionnaire was made | To get a grip on the customer needs for the concept which helps people to board a train more uniformly, a questionnaire was made and has been distributed among a diverse group of people. | ||
The goal of the questionnaire is split in two parts. Firstly, the satisfaction of train travelers from their chance of getting a seat is monitored, as well as whether they use the current NS app to improve their chance. The second goal of this questionnaire is determining content of the improved app that the travelers want themselves. | The goal of the questionnaire is split in two parts. Firstly, the satisfaction of train travelers from their chance of getting a seat is monitored, as well as whether they use the current NS app to improve their chance. The second goal of this questionnaire is determining content of the improved app that the travelers want themselves. | ||
| Line 104: | Line 104: | ||
=== Opinion on chance of getting a seat === | === Opinion on chance of getting a seat === | ||
Respondents evaluate their chance as good. 73.2% typically find a seat and are satisfied with their chance. This number is slightly lower than the number NS distributes in their yearly report about the chance of getting a seat, being 95,1% in 2018 [https://www.nsjaarverslag.nl/jaarverslag-2018/a1221_2018-in-een-notendop?fbclid=IwAR34aVXU49RdKT8YdpGI7_8ymAgmWHmFs7RtBYG2P7nnAqPpm1D1tYCezJY]. Also, a difference between people traveling during rush hour and people traveling outside of these peak hours. The former evaluate their chance of having a seat as 3.22 out of 5, while the latter evaluate this chance at 4.33 out of 5. The satisfaction that belongs to this chance of seat is 3.44 out of 5 for rush hour and 4.33 outside rush hour (on a scale of 1 to 5 again). Crowdedness in the trains is judged neither a problem, nor a positive. A general preference can be found for the specific compartment where a commuter boards the train. 88.5% mostly walk to a place with low person density at the platform to avoid a crowd gathered around the predicted stopping place. Of this majority, 53% always walk a distance to increase their chance of a seat. Of these people, 85% would even walk towards the other side of the platform, if their chance of getting a seat | Respondents evaluate their chance of getting a seat as good. 73.2% typically find a seat and are satisfied with their chance. This number is slightly lower than the number NS distributes in their yearly report about the chance of getting a seat, being 95,1% in 2018 [https://www.nsjaarverslag.nl/jaarverslag-2018/a1221_2018-in-een-notendop?fbclid=IwAR34aVXU49RdKT8YdpGI7_8ymAgmWHmFs7RtBYG2P7nnAqPpm1D1tYCezJY]. Also, a difference between people traveling during rush hour and people traveling outside of these peak hours. The former evaluate their chance of having a seat as 3.22 out of 5, while the latter evaluate this chance at 4.33 out of 5. The satisfaction that belongs to this chance of seat is 3.44 out of 5 for rush hour and 4.33 outside rush hour (on a scale of 1 to 5 again). Crowdedness in the trains is judged neither a problem, nor a positive. However, to achieve the results that the NS is striving to, action should be taken. <br\> A general preference can be found for the specific compartment where a commuter boards the train. 88.5% mostly walk to a place with low person density at the platform to avoid a crowd gathered around the predicted stopping place. Of this majority, 53% always walk a distance to increase their chance of a seat. Of these people, 85% would even walk towards the other side of the platform, if their chance of getting a seat was(almost) guaranteed, while only about 15% would maybe do it or not at all (4.3%). This boarding behavior is the same for passengers during and outside rush hour. A minor difference of 0.08 on a scale to 10 is found. | ||
=== What information do people want to know === | === What information do people want to know === | ||
| Line 120: | Line 120: | ||
== Technical Content == | == Technical Content == | ||
===Counting=== | ===Counting=== | ||
Counting people could be done in various ways. Currently, NS already uses weighbridges | Counting people could be done in various ways. Currently, NS already uses weighbridges [https://nos.nl/artikel/2271485-ns-vrije-zitplaatsen-op-meer-trajecten-in-app-te-zien.html\], Amtrak and some busses in America are using treadle mats [https://www.google.com/url?sa=t&rct=j&q=&esrc=s&source=web&cd=9&cad=rja&uact=8&ved=2ahUKEwiR9p2Uw4HiAhWNZ1AKHUeuBI4QFjAIegQIAhAC&url=http%3A%2F%2Fwww.movetec.fi%2Fimages%2Fpdf%2FTapeswitch-tuntoreunat.pdf&usg=AOvVaw0I2j-QILXPBH48Jq9N8T_d] and infra red beams are used in South-Africa to monitor the corrupt behavior of some bus drivers [https://www.researchgate.net/publication/267387412_APPROPRIATE_TECHNOLOGY_FOR_AUTOMATIC_PASSENGER_COUNTING_ON_PUBLIC_TRANSPORT_VEHICLES_IN_SOUTH_AFRICA]. However, all these options require quite a few adaptations to the public transportation or the rail network itself and therefore can be quite expensive. | ||
==== Weighbridges ==== | ==== Weighbridges ==== | ||
| Line 129: | Line 129: | ||
! | ! | ||
! colspan="3" | Available seating (average 93 seats per compartment) | ! colspan="3" | Available seating (average 93 seats per compartment) | ||
! colspan="3" | Including standing (average 146 places per compartment | ! colspan="3" | Including standing (average 146 places per compartment) | ||
|- | |- | ||
| Gender | | Gender | ||
| Line 162: | Line 162: | ||
| 6510 | | 6510 | ||
| 102 | | 102 | ||
| 9 | | +9 | ||
| 10220 | | 10220 | ||
| 161 | | 161 | ||
| 15 | | +15 | ||
|} | |} | ||
When taking into account only the seated places in the train, depending on the gender composition of the passengers, the number of people on the train can vary by seventeen. This shows that the determining the amount of people in a compartment is not accurate enough if the aim is to use the information to determine if there is a chance of finding a seat. If the system would be used to tell which compartment has the most space, so standing and seating combined, the possible measuring inaccuracy would increase to a possible difference of over twenty seven people. | When taking into account only the seated places in the train, depending on the gender composition of the passengers, the number of people on the train can vary by seventeen. This shows that the determining the amount of people in a compartment is not accurate enough if the aim is to use the information to determine if there is a chance of finding a seat. If the system would be used to tell which compartment has the most space, so standing and seating combined, the possible measuring inaccuracy would increase to a possible difference of over twenty seven people. | ||
| Line 174: | Line 174: | ||
A more promising option would be using the location of a mobile phone of travelers. This can be done in several ways: <br /> | A more promising option would be using the location of a mobile phone of travelers. This can be done in several ways: <br /> | ||
'''Bluetooth''': | '''Bluetooth''': | ||
Bluetooth tracking systems can be used. Of all people who have a phone, about 40% have Bluetooth turned on. Therefore we could use Bluetooth-beacons to count the number of Bluetooth devices and extrapolate the data. Bluetooth beacons cost about | Bluetooth tracking systems can be used. Of all people who have a phone, about 40% have Bluetooth turned on. Therefore we could use Bluetooth-beacons to count the number of Bluetooth devices and extrapolate the data. Bluetooth beacons cost about €9 per piece and have a range of about 50 meters. According to [https://www.nu.nl/binnenland/4495818/ns-verhoogt-aantal-inzetbare-treinen-in-vijf-jaar-met-37-procent.html nu.nl ], the NS wants to have 4077 compartments in 2022, so installing 2 beacons per compartment would cost €81.540. | ||
This is definitely the cheapest option, however the question is how accurate this is. Research did show that in a crowd of ~16,000 people it has an accuracy of about 17.9%, but in trains you don't work with crowds of this size. Since Bluetooth counting is less accurate than the current system using weight-bridges, we decided to shelf this idea. <br /> | This is definitely the cheapest option, however the question is how accurate this is. Research did show that in a crowd of ~16,000 people it has an accuracy of about 17.9%, but in trains you don't work with crowds of this size. Since Bluetooth counting is less accurate than the current system using weight-bridges, we decided to shelf this idea. <br /> | ||
| Line 181: | Line 181: | ||
'''Bliptrack''': | '''Bliptrack''': | ||
Bliptrack is a system combining the 2 methods above. It detects Wifi/BLE/Bluetooth-enabled devices | Bliptrack is a system combining the 2 methods above. It detects Wifi/BLE/Bluetooth-enabled devices [https://blipsystems.com/hardware-overview/]. By placing these sensors inside the compartment at critical places, such as inside the coupé and at the balcony, a proper measurement can be made of how many mobile phones are present inside the train. <br /> | ||
With all these methods, there is a small group of people that is not accounted for in the trains: People that are not using their phone because they just don't, or people that do not even have a phone. Figure 1 shows the amount of people living in the Netherlands without a phone. A questionnaire under 3000 people has showed that 87 percent of Dutch citizens are in possession of a phone. The most promising growing group consists of seniors. That group was growing by 19 percent per year in 2016, while 18-34 has grown with 3 percent and 35-54 with 7 percent. Other instances like statica find of mobile phone usage of 85 percent. Of those approximate 14.5 million people, 52 percent use their phone while using public transportation. However, there is 1 problem with this method. Usage of smartphones and therefore also Bluetooth can differ per coupé. If more younger or older people are seated in a carriage, the number of people in the carriage can get misjudged, since these people all deviate from the average users. <br /> | With all these methods, there is a small group of people that is not accounted for in the trains: People that are not using their phone because they just don't not using it at that moment, or people that do not even have a phone. Figure 1 shows the amount of people living in the Netherlands without a phone. A questionnaire under 3000 people has showed that 87 percent of Dutch citizens are in possession of a phone. The most promising growing group consists of seniors. That group was growing by 19 percent per year in 2016, while 18-34 has grown with 3 percent and 35-54 with 7 percent. Other instances like statica find of mobile phone usage of 85 percent. Of those approximate 14.5 million people, 52 percent use their phone while using public transportation. However, there is 1 problem with this method. Usage of smartphones and therefore also Bluetooth can differ per coupé at any given time. If more younger or older people are seated in a carriage, the number of people in the carriage can get misjudged, since these people all deviate from the average users. <br /> | ||
<br /> | <br /> | ||
| Line 191: | Line 191: | ||
'''Tracking OV-chipcards'''. | '''Tracking OV-chipcards'''. | ||
Till 2008, all OV-chipcards had an RFID-chip. Nowadays they have an NFC-chip. We cannot track people using an NFC-chip, | Till 2008, all OV-chipcards had an RFID-chip. Nowadays they have an NFC-chip. We cannot track people using an NFC-chip since the reach of these chips is limited to less than half a meter. However, RFID-chip can be used. RFID-chips are relatively cheap (€0.06 per piece), so we could put them back in the OV-chipcards, separate from the NFC-chip, making it such that almost all paying passengers can be tracked. The main drawback is that it would take 5 years to phase the RFID-chips in (Since that's the time an OV-chipcard is valid). The range of such a cheap chip is also only a couple of meters, requiring a lot of beacons.<br /> | ||
'''Carbon Dioxide''' | '''Carbon Dioxide''' | ||
This would also be cheap to implement, as CO2 sensors cost around | This would also be cheap to implement, as CO2 sensors cost around €90 and only one per compartment would be needed. CO2 sensors can reach a high accuracy in a closed environment for low amount of people. Accuracy for up to 4 people can reach 94%. Accuracy for more people in a small closed room will be 60%-80%. However a train is not a closed environment with doors opening and closing at each stop and ventilation systems working. So this accuracy is likely to be on the low end of the 60%-80% range. [https://arxiv.org/ftp/arxiv/papers/1706/1706.05286.pdf] | ||
'''InfraRed sensors''' | '''InfraRed sensors''' | ||
This would be a good solution since the sensors are relatively cheap, they go from | This would be a good solution since the sensors are relatively cheap, they go from €70 per piece. With this system, each compartment would need a minimum of 4 sensors. This has to be implemented in 4077 compartments, so the materials would cost €572381 plus installation costs. Study that implemented infrared counting system in busses has shown that people did not notice the presence of the sensors and that such system gave accuracy levels around 99%. [https://www.researchgate.net/publication/267387412_APPROPRIATE_TECHNOLOGY_FOR_AUTOMATIC_PASSENGER_COUNTING_ON_PUBLIC_TRANSPORT_VEHICLES_IN_SOUTH_AFRICA]. Disadvantage of such system is that each counting error will not be corrected till the end of the traject. So the longer train is active the more these small errors will add up. <br /> | ||
===Needed Data=== | ===Needed Data=== | ||
| Line 215: | Line 215: | ||
'''More valuable data''' | '''More valuable data''' | ||
The data gathered from the infra red sensors is more valuable than the data from the weighbridges, because the infrared gates can distinguish between the occupancy levels of the upper and lower compartment in double | The data gathered from the infra red sensors is more valuable than the data from the weighbridges, because the infrared gates can distinguish between the occupancy levels of the upper and lower compartment in double decker trains. They could also distinguish between first and second class by adding one extra gate. Another advantage is that the infra red sensors can keep track of the passengers switching compartments during the trip and the weighbridges can only measure when the train is leaving the platform. | ||
'''Accuracy''' | '''Accuracy''' | ||
| Line 223: | Line 223: | ||
'''Costs''' | '''Costs''' | ||
It is much cheaper to implement infrared gates in each train, than it is to install weighbridges on each platform in the Netherlands. See the [[#Costs|costs]] section | It is much cheaper to implement infrared gates in each train, than it is to install weighbridges on each platform in the Netherlands. See the [[#Costs|costs]] section. | ||
'''Downsides''' | '''Downsides''' | ||
This technology however has two important downsides. The first problem is that counting errors will add up during the traject, because when a person is accidentally counted twice, the compartment will keep counting one person too much until the whole counter is reset. However we do not think that this error is a lot since the accuracy of the counting is very high and we can reset the count after each traject. | This technology however has two important downsides. The first problem is that counting errors will add up during the traject, because when a person is accidentally counted twice, the compartment will keep counting one person too much until the whole counter is reset. However we do not think that this error is a lot since the accuracy of the counting is very high and we can reset the count after each traject. Also, when train personel sees that the data is not right, they could reset the count and put in the correct number. | ||
The second problem is that the infrared sensors have to be cleaned regularly for them to work optimally. This can be done during the cleaning of the train when the bins get emptied, which is done regularly enough. | The second problem is that the infrared sensors have to be cleaned regularly for them to work optimally. This can be done during the cleaning of the train when the bins get emptied, which is done regularly enough. | ||
===Data Processing=== | ===Data Processing=== | ||
[[File:Uml-group7.PNG| 400px | thumb | right | Figure 3: Overview of how the system works]] | [[File:Uml-group7.PNG| 400px | thumb | right | Figure 3: Overview of how the system works]] | ||
Knowing the needed data, an overview of how the system works can be made (figure 3). At both | Knowing the needed data, an overview of how the system works can be made (figure 3). At both entrances of the seating area two bidirectional infrared sensor will be placed, as well as at the door between the first and second class seating area in certain compartments. These sensors will be capable of determining if a traveller is entering or exiting the seating area of the compartment, so they detect the person presence and its direction. This means that for each compartment of the VIRM, a minimum of eight sensors will be needed at the doors to the seating area. The amount of sensors may increase if there is a first and second class compartment at the top and/ or bottom layer of the train. The total number of infrared sensors will vary per compartment from eight sensors when only second class seating is present to twelve when both first and second class seating is available at both the top and bottom level of the train compartment. | ||
By combining the information from the infrared sensors at each end of the compartment and the sensor between first and second class, it should be possible to get an accurate number for the amount of passengers seated in each class of a compartment. This combination of infrared sensors should be capable of reliably and accurately providing information about the amount of travellers in each sitting area in real-time. | By combining the information from the infrared sensors at each end of the compartment and the sensor between first and second class, it should be possible to get an accurate number for the amount of passengers seated in each class of a compartment. This combination of infrared sensors should be capable of reliably and accurately providing information about the amount of travellers in each sitting area in real-time. | ||
| Line 260: | Line 260: | ||
=== App indication === | === App indication === | ||
[[File:App.PNG|400px|thumb | Figure | [[File:App.PNG|400px|thumb | Figure 6: The App design (click image to expand)]] | ||
[[File:Wheelchair.PNG|400px|thumb | Figure | [[File:Wheelchair.PNG|400px|thumb | Figure 7: App shows where wheelchair and bike entrances are (click image to expand)]] | ||
NS has already experimented with showing train carriage capacity in their apps. However with our live and more precise counting we can make improvements on that App system. With this new information we can distinguish between the upper and lower compartment of the train and we can even distinguish between first and second class. This is especially useful when a train is very full. In this case the second class is crowded, but often there are enough seats in first class compartments. The app can show first class travelers where seats will be available. | NS has already experimented with showing train carriage capacity in their apps. However with our live and more precise counting we can make improvements on that App system. With this new information we can distinguish between the upper and lower compartment of the train and we can even distinguish between first and second class. This is especially useful when a train is very full. In this case the second class is crowded, but often there are enough seats in first class compartments. The app can show first class travelers where seats will be available. | ||
The app displays every compartment of the train with an indication color which shows how busy it is. With this information train travelers can decide to board a carriage which is less full (see figure | The app displays every compartment of the train with an indication color which shows how busy it is. With this information train travelers can decide to board a carriage which is less full (see figure 6). The questionnaire showed that many people (46.2%) would prefer a coloring that goes from green (not busy) via yellow to red (very busy) over a colorblind coloring from blue to orange [http://cstwiki.wtb.tue.nl/index.php?title=File:Q20_G7.png]. So we decided to make this the standard and add a setting to change the colors in the app for colorblind people. | ||
From the questionnaire we also found out that train travelers would want to know where bike and wheelchair entrances are in the app. So we made a design to keep the app simple but also give this extra information. The design uses a toggle button for wheelchair and bike, when the user presses this button the coloring of the carriages changes to gray for unavailable or to blue for available. (see figure | From the questionnaire we also found out that train travelers would want to know where bike and wheelchair entrances are in the app. So we made a design to keep the app simple but also give this extra information. The design uses a toggle button for wheelchair and bike, when the user presses this button the coloring of the carriages changes to gray for unavailable or to blue for available. (see figure 7) | ||
Lastly the app gives travelling advice to the user. For example see figure | Lastly the app gives travelling advice to the user. For example see figure 6; "62% more chance for a seat in wagon 3". These messages will be live generated and can be personalized. Some examples of personalisation are seat allocation for people who travel first class, advice people in wheelchairs or drive with bikes only compartments that have such special entrences. Or if 40 people check the app at the same time, we could advice next users to board a different compartment, because not all users should board the same compartment. | ||
We tested the design of the app to Users, to see if users would understand the app and be able to work with it. 8 participants agreed to test out app, all participants were smartphone users. 5 participants were the age of 18 to 20 and considered themselves digital capable, 2 of them had never used NS-app. Two participants were in their 50s - one considered digitally capable, and the other considered less digitally capable, both had never used NS-app. The last participant was the age of 80, she considered herself less capable of using smartphones and had never used the NS-app. | We tested the design of the app to Users, to see if users would understand the app and be able to work with it. 8 participants agreed to test out the app, all participants were smartphone users. 5 participants were the age of 18 to 20 and considered themselves digital capable, 2 of them had never used NS-app. Two participants were in their 50s - one considered digitally capable, and the other considered less digitally capable, both had never used NS-app. The last participant was the age of 80, she considered herself less capable of using smartphones and had never used the NS-app. | ||
For the experiment the app was set up as in the example of figure | For the experiment the app was set up as in the example of figure 6 and asked the participants 3 questions. First question was: "If you were waiting at this station which compartment would you board?" all participants answered wagon 3. This indicates that the boarding advice is easily readable. Second question was: "If you see a lot of people on the platform waiting in front of compartment 3, which compartment would you board? 2 participant would board wagon 4, since that was next to 3 and the app indicated that wagon 4 was medium full. the other participants would board wagon 6, since that one was almost empty. This indicates to us that the capacity display of each wagon is also pretty well readable. Last question was: "What if you were in a wheelchair? What compartment would you board?". 6 participants were able to identify that the wheelchair and the bike signs were buttons and they all decided after pressing the wheelchair button to board wagon 4. The other two participants did not recognise that they could press these buttons and would have gone to a compartment without special wheelchair space. We decided to extend the app by adding text underneath the buttons to indicate that they are pressable. | ||
The app could be extended, by calculating estimates to predict how full a train will be at what time, so travelers can decide to take the next train or another route. These estimates can be based on previous data of the same train on the same traject and time. This way the app shows live data when available and estimated data when not available. | The app could be extended, by calculating estimates to predict how full a train will be at what time, so travelers can decide to take the next train or another route. These estimates can be based on previous data of the same train on the same traject and time. This way the app shows live data when available and estimated data when not available. | ||
| Line 279: | Line 279: | ||
=== NS trains === | === NS trains === | ||
Information about the composition of the VIRM that was available. | |||
[[File:VIRM_NS_group_7.jpeg| 400px | thumb | left | Figure 8: Overview of the seating from the VIRM III and VIRM IV]] | |||
{| class="wikitable" | border="1" style="border-collapse:collapse" | {| class="wikitable" | border="1" style="border-collapse:collapse" | ||
! style="font-weight:bold"; | VIRM train | ! style="font-weight:bold"; | VIRM train | ||
| Line 289: | Line 289: | ||
! style="font-weight:bold"; | Compartment 5 | ! style="font-weight:bold"; | Compartment 5 | ||
! style="font-weight:bold"; | Compartment 6 | ! style="font-weight:bold"; | Compartment 6 | ||
! style="font-weight:bold"; | | ! style="font-weight:bold"; | Empty weight(tons) | ||
! style="font-weight:bold"; | Number of seats | ! style="font-weight:bold"; | Number of seats | ||
|- | |- | ||
| Line 368: | Line 368: | ||
==== Infrared sensors ==== | ==== Infrared sensors ==== | ||
In each carriage of a VIRM train, the plan is to install 4 bidirectional sensors (one at each end of each door to a seating area), + 1 or 2 additional sensors if the carriage is a split 1st/2nd class carriage. Bidirectional sensors are available from | In each carriage of a VIRM train, the plan is to install 4 bidirectional sensors (one at each end of each door to a seating area), + 1 or 2 additional sensors if the carriage is a split 1st/2nd class carriage. Bidirectional sensors are available from €220 and upwards, but, to get an upperbound on the cost, let's assume we buy them at €300. <br /> | ||
There are 2 types of VIRM trains still in use: the VIRM 4 trains and the VIRM 6 trains. | There are 2 types of VIRM trains still in use: the VIRM 4 trains and the VIRM 6 trains. | ||
The VIRM 4 has 4 compartements, of which 2 are split. Each VIRM 4 will need 19 sensors in total, making the cost €5700 per train (at €300 per sensor). The NS currently has 98 VIRM 4 trains, making the total cost for all VIRM 4 trains €558600 | The VIRM 4 has 4 compartements, of which 2 are split. Each VIRM 4 will need 19 sensors in total, making the cost €5700 per train (at €300 per sensor). The NS currently has 98 VIRM 4 trains, making the total cost for all VIRM 4 trains €558600 | ||
| Line 377: | Line 377: | ||
LED display tiles vary in price between 50 and 200 euros, however some of the cheaper models are not sure to withstand being stepped onto. | LED display tiles vary in price between 50 and 200 euros, however some of the cheaper models are not sure to withstand being stepped onto. | ||
LED display tiles are usually 30x30 [https://www.tme.eu/nl/details/mikroe-2370/accessoires-voor-ontwikkelkits/mikroelektronika/32x32-rgb-led-matrix-panel-5mm-pitch/?brutto=1&gclid=CjwKCAjw8qjnBRA-EiwAaNvhwO4lozUZKg4D8ydjKoQ3gLdrQ5SkViXDx8fD-96iE1AZadhmUTFdDBoCaSkQAvD_BwE] [https://www.ledpaneelgroothandel.nl/led-paneel-30-30-rgbww?gclid=CjwKCAjw8qjnBRA-EiwAaNvhwKpr5Lu4D-1zS0ht7N8aCtQOFY56zfpcKyO5uS8NKmcwmmDLUJPXBBoCR8QQAvD_BwE] or 60x60 [https://www.djgear.nl/showtec-dancefloor-sparkle-rgb.html] tiles. Based on these sources, a good estimate price for a 30x30 tile would be 50 euros. Since a train compartment is 25-30 meters long, and since most train configurations include 3-6 compartments, averaging at 4-5, we could estimate 100-120 meters per train. | LED display tiles are usually 30x30 [https://www.tme.eu/nl/details/mikroe-2370/accessoires-voor-ontwikkelkits/mikroelektronika/32x32-rgb-led-matrix-panel-5mm-pitch/?brutto=1&gclid=CjwKCAjw8qjnBRA-EiwAaNvhwO4lozUZKg4D8ydjKoQ3gLdrQ5SkViXDx8fD-96iE1AZadhmUTFdDBoCaSkQAvD_BwE] [https://www.ledpaneelgroothandel.nl/led-paneel-30-30-rgbww?gclid=CjwKCAjw8qjnBRA-EiwAaNvhwKpr5Lu4D-1zS0ht7N8aCtQOFY56zfpcKyO5uS8NKmcwmmDLUJPXBBoCR8QQAvD_BwE] or 60x60 [https://www.djgear.nl/showtec-dancefloor-sparkle-rgb.html] tiles. Based on these sources, a good estimate price for a 30x30 tile would be 50 euros. Since a train compartment is 25-30 meters long, and since most train configurations include 3-6 compartments, averaging at 4-5, we could estimate 100-120 meters per train. | ||
This would mean about 300-400 tiles per train pier, and if we assume 4 piers average per station, this means about | This would mean about 300-400 tiles per train pier, and if we assume 4 piers average per station, this means about 1500 tiles per station, amounting to about 50 thousand euros per station, or 20 million euros total across all stations. | ||
=== Summary === | === Summary === | ||
| Line 514: | Line 514: | ||
2) Erden, F. (2017). "A robust system for counting people using an infrared sensor and a camera". Infrared Physics & Technology, 72. Retrieved from https://www.researchgate.net/publication/280735165_A_robust_system_for_counting_people_using_an_infrared_sensor_and_a_camera <br \> | 2) Erden, F. (2017). "A robust system for counting people using an infrared sensor and a camera". Infrared Physics & Technology, 72. Retrieved from https://www.researchgate.net/publication/280735165_A_robust_system_for_counting_people_using_an_infrared_sensor_and_a_camera <br \> | ||
3) https://www.dilax.com/en/public-mobility/portfolio/seat-management/<br \> | 3) https://www.dilax.com/en/public-mobility/portfolio/seat-management/<br \> | ||
4) Sojol, J.I.(2018). "Smart Bus: An Automated Passenger Counting System" | 4) Sojol, J.I.(2018). "Smart Bus: An Automated Passenger Counting System", ICICSA. Retrieved from https://www.researchgate.net/publication/323027620_Smart_Bus_An_Automated_Passenger_Counting_System<br \> | ||
5) https://www.google.nl/url?sa=t&rct=j&q=&esrc=s&source=web&cd=21&cad=rja&uact=8&ved=2ahUKEwiCudCpgPbhAhUJr6QKHRJQBlM4ChAWMAp6BAgIEAI&url=https%3A%2F%2Fpdfs.semanticscholar.org%2F55a0%2F9a9adb1e7905f99607846f7a286e3f39bf17.pdf&usg=AOvVaw0ZK1-RYUZ15nYZshrA0cHs<br \> | 5) Letshwiti, V. (2004). "Appropriate technology for automatic passenger counting on public transport vehicles in South Africa", CSIR Transportek. Retrieved from https://www.google.nl/url?sa=t&rct=j&q=&esrc=s&source=web&cd=21&cad=rja&uact=8&ved=2ahUKEwiCudCpgPbhAhUJr6QKHRJQBlM4ChAWMAp6BAgIEAI&url=https%3A%2F%2Fpdfs.semanticscholar.org%2F55a0%2F9a9adb1e7905f99607846f7a286e3f39bf17.pdf&usg=AOvVaw0ZK1-RYUZ15nYZshrA0cHs<br \> | ||
6) https://www.usenix.org/legacy/events/hotos03/tech/full_papers/gruteser/gruteser_html/<br \> | 6) Gruteser, M. (2003). "Privacy-Aware Location Sensor Networks", Boulder, CO. Retrieved from https://www.usenix.org/legacy/events/hotos03/tech/full_papers/gruteser/gruteser_html/<br \> | ||
7) Letshwiti, V ( | 7) Letshwiti, V. (ND). "APPROPRIATE TECHNOLOGY FOR AUTOMATIC PASSENGER COUNTING ON PUBLIC TRANSPORT VEHICLES IN SOUTH AFRICA", CSIR Transportek. Retrieved from https://www.researchgate.net/publication/267387412_APPROPRIATE_TECHNOLOGY_FOR_AUTOMATIC_PASSENGER_COUNTING_ON_PUBLIC_TRANSPORT_VEHICLES_IN_SOUTH_AFRICA <br\> | ||
8) https://www.google.com/url?sa=t&rct=j&q=&esrc=s&source=web&cd=9&cad=rja&uact=8&ved=2ahUKEwiR9p2Uw4HiAhWNZ1AKHUeuBI4QFjAIegQIAhAC&url=http%3A%2F%2Fwww.movetec.fi%2Fimages%2Fpdf%2FTapeswitch-tuntoreunat.pdf&usg=AOvVaw0I2j-QILXPBH48Jq9N8T_d <br\> | 8) https://www.google.com/url?sa=t&rct=j&q=&esrc=s&source=web&cd=9&cad=rja&uact=8&ved=2ahUKEwiR9p2Uw4HiAhWNZ1AKHUeuBI4QFjAIegQIAhAC&url=http%3A%2F%2Fwww.movetec.fi%2Fimages%2Fpdf%2FTapeswitch-tuntoreunat.pdf&usg=AOvVaw0I2j-QILXPBH48Jq9N8T_d <br\> | ||
9) http://www.instantcounting.com/technology.html <br \> | 9) http://www.instantcounting.com/technology.html <br \> | ||
| Line 526: | Line 526: | ||
14) https://www-sciencedirect-com.dianus.libr.tue.nl/science/article/pii/0262885694900531<br \> | 14) https://www-sciencedirect-com.dianus.libr.tue.nl/science/article/pii/0262885694900531<br \> | ||
16) https://patents.google.com/patent/US7788063B2/en <br \> | 16) Bodin, W.K. (2010). "UTILIZING GROSS VEHICLE WEIGHT TO DETERMINE PASSENGER NUMBERS", ????. Retrieved from https://patents.google.com/patent/US7788063B2/en <br \> | ||
17) https://trid.trb.org/view/481481 <br \> | 17) Greneker III, E. (1996). "MPROVED PASSENGER COUNTER AND CLASSIFIER SYSTEM FOR TRANSIT OPERATIONS", ????. Retreived from https://trid.trb.org/view/481481 <br \> | ||
18) https://blipsystems.com/hardware-overview/ <br \> | 18) https://blipsystems.com/hardware-overview/ <br \> | ||
19) https://nos.nl/artikel/2271485-ns-vrije-zitplaatsen-op-meer-trajecten-in-app-te-zien.html <br \> | 19) https://nos.nl/artikel/2271485-ns-vrije-zitplaatsen-op-meer-trajecten-in-app-te-zien.html <br \> | ||
20) https://repository.tudelft.nl/islandora/object/uuid:a67e550b-5c38-456e-9e21-90802ad36f6a?collection=education <br \> | 20) Lentz, S.F. (2010). "Platform Positioner: A Dutch Railways information service that motivates passengers to spread over the platform by providing a personal boarding advice.", ????. Retreived from https://repository.tudelft.nl/islandora/object/uuid:a67e550b-5c38-456e-9e21-90802ad36f6a?collection=education <br \> | ||
21) https://www.researchgate.net/publication/276408492_Semisupervised_Pedestrian_Counting_With_Temporal_and_Spatial_Consistencies <br \> | 21) Xia, W. (2015). "Semisupervised Pedestrian Counting With Temporal and Spatial Consistencies", 10.1109/TITS.2014.2371333. Retreived from https://www.researchgate.net/publication/276408492_Semisupervised_Pedestrian_Counting_With_Temporal_and_Spatial_Consistencies <br \> | ||
22) https://www.its.ucla.edu/wp-content/uploads/sites/6/2015/11/passenger-flows-in-underground-railways-stations-platform.pdf <br \> | 22) Loukaitou-Sideris, A. (2015). "PASSENGER FLOWS IN UNDERGROUND RAILWAY STATIONS AND PLATFORMS",10.3141/2216-13. Retreived from https://www.its.ucla.edu/wp-content/uploads/sites/6/2015/11/passenger-flows-in-underground-railways-stations-platform.pdf <br \> | ||
23) http://www.strc.ch/2017/Bosina_EtAl.pdf <br \> | 23) Bosina, E. (2017). "Pedestrian flows on railway platforms", ????. Retreived from http://www.strc.ch/2017/Bosina_EtAl.pdf <br \> | ||
24) http://ijtte.com/uploads/2018-12-08/b2ddb9bc-d1c1-4333ijtte.2018.8(4).04.pdf <br \> | 24) Rüger, B. (2018). "HOW PLATFORM INFRASTRUCTURE INFLUENCES PASSENGER BEHAVIOUR", 10.7708/ijtte.2018.8(4).04. Retreived from http://ijtte.com/uploads/2018-12-08/b2ddb9bc-d1c1-4333ijtte.2018.8(4).04.pdf <br \> | ||
25) https://www.deutschebahn.com/en/Digitalization/DB_Digital/productworld/Luminous_Plazfrom_en-1214708 <br \> | 25) https://www.deutschebahn.com/en/Digitalization/DB_Digital/productworld/Luminous_Plazfrom_en-1214708 <br \> | ||
26) https://onlinelibrary.wiley.com/doi/abs/10.1002/atr.5670180102 <br \> | 26) Szplett, D. (1984). "An investigation of passenger interchange and train standing time at LRT stations: (i) Alighting, boarding and platform distribution of passengers", https://doi.org/10.1002/atr.5670180102 . Retreived from https://onlinelibrary.wiley.com/doi/abs/10.1002/atr.5670180102 <br \> | ||
27) https://ieeexplore.ieee.org/stamp/stamp.jsp?tp=&arnumber=8117189 <br \> | 27) Danielis, P. (2017). "UrbanCount: Mobile crowd counting in urban environments", 10.1109/IEMCON.2017.8117189. Retreived from https://ieeexplore.ieee.org/stamp/stamp.jsp?tp=&arnumber=8117189 <br \> | ||
28) https://www.mdpi.com/1424-8220/12/10/14196 <br \> | 28) Versichele,M. (2012). "Mobile Mapping of Sporting Event Spectators Using Bluetooth Sensors: Tour of Flanders 2011", https://doi.org/10.3390/s121014196. Retreived from https://www.mdpi.com/1424-8220/12/10/14196 <br \> | ||
29) https://www.businessinsider.nl/ns-werkt-hard-aan-zijn-reputatie-maar-er-zijn-weinig-organisaties-waar-nederlanders-zo-graag-afgeven/ (Dutch)<br /> | 29) Ramaer, J. (2017). "NS werkt hard aan zijn reputatie – maar er zijn weinig organisaties waar Nederlanders zo graag op afgeven". Retreived from https://www.businessinsider.nl/ns-werkt-hard-aan-zijn-reputatie-maar-er-zijn-weinig-organisaties-waar-nederlanders-zo-graag-afgeven/ (Dutch)<br /> | ||
30) https://www.nsjaarverslag.nl/jaarverslag-2018/a1221_2018-in-een-notendop?fbclid=IwAR34aVXU49RdKT8YdpGI7_8ymAgmWHmFs7RtBYG2P7nnAqPpm1D1tYCezJY | 30) https://www.nsjaarverslag.nl/jaarverslag-2018/a1221_2018-in-een-notendop?fbclid=IwAR34aVXU49RdKT8YdpGI7_8ymAgmWHmFs7RtBYG2P7nnAqPpm1D1tYCezJY | ||
Latest revision as of 22:39, 24 June 2019
Group members:
| Name | Student ID | Study | |
|---|---|---|---|
| Emiliyan Greshkov | 1281666 | e.greshkov@student.tue.nl | Computer Science |
| Thomas Janss | 1006697 | t.f.w.janss@student.tue.nl | Mechanical Engineering |
| Perry Kloet | 1236356 | p.a.j.kloet@student.tue.nl | Computer Science |
| Bram Schut | 1019001 | b.b.j.schut@student.tue.nl | Computer Science |
| Sem de Werdt | 1017882 | s.j.a.d.werdt@student.tue.nl | Automotive Technology |
General information:
Problem statement and objectives
As our urban environment grows, so does the need for means of transport for commuters and leisure travelers. Trains are getting cramped and more overcrowded. This makes it increasingly more important to use the available space and seating optimally to maximize the amount of people in the train and the comfort in which these people can travel.
A lot can be improved in terms of space usage in trains. We want to achieve this goal by providing train passengers with accurate and real-time boarding data. This data can be used to give the passengers information on where best to board the train. We will deliver a system to measure live information about the occupancy rate of compartments, with a high accuracy/cost ratio. This information can be displayed on all kinds of interfaces, such as websites and apps, but also on interactive train platforms or on screens within the trains.
Research from the University of Queensland has shown that passenger distribution within train carriages is skewed. [1] They studied if this skewness would be corrected by showing waiting passengers prior to the arrival of each train. They made an agent-based simulation to model the behavior of passengers with occupancy information and without occupancy information. The simulation where passengers were provided with occupancy level information got much better spread over the train and got a lower overall passenger boarding time.
The focus during the project will be on trains in the Dutch railway network, since trains, stations, railway networks and stakeholders differ a lot all over the world, which makes it hard to create a uniform design that will work everywhere. However, this system design can be modified for implementation in different environments.
Many railway companies are already experimenting on this subject. The state of the art in the Netherlands is the NS, that is showing how crowded each compartment is in their app. [2] They get this information by building weighbridges into the tracks of each station platform and weigh each compartment. However this method only creates a rough estimate of how crowded each compartment is and this measuring can only be done upon departure of the train. We want to make a system that does active measuring, that can make an estimation in real-time and have a higher accuracy than the system that NS is using now.
Prorail is also experimenting with the implementation of Interactive platform bars (IPB) which indicate how busy each compartment is. At the time of writing of this paper they are experimenting with an IPB at Schiphol Airport station [3] and s'Hertogenbosch train station. [4]
In this project we will focus on three parts. The first part is the measuring. As said above we want to measure in real-time and achieve a higher accuracy. Part two is the processing of this measuring data. What information can we get from this data and in what ways it can be used. The final part of the project will be how this information can be communicated to the train passengers. There we will give examples in what ways this data can be used to make passengers better distribute over the train.
User, Society and Enterprise
Users
The main users that this system will affect are train travellers, which will benefit from an increased spread of people along the train. Passengers will be able to spread out more at the platform, due to displayed information before the arrival of the train at the platform. Having boarded the train, the chance of a seat will be higher than when randomly boarding the train. This way, uneven distribution of clusters of travelers in different carriages can be prevented. This ensures more comfort for passengers, both inside of the train and while boarding or waiting for the train.
Users generally want to board the train in an empty area, so that they can find a seat whilst avoiding walking too much inside the train or walking through the entire train without finding a place. Because of this, users want to know where people in the train are.
Another issue is the privacy of the users. People generally don't want to be tracked, or at least not individually tracked. Therefore a system that tracks the count of people anomynously is preferable.
Society
It is well known that because of CO2-emission and traffic jams, society would benefit if people use more public transport. However, a huge problem with this in the Netherlands is that the NS currently has a bad reputation [5]. One of the ways they hope to improve their reputation is by improving passenger comfort. Our system can help the NS improve on this matter, which in turn would attract more passengers and will benefit society by extention.
Enterprise
Enterprises should also profit from this new technology. Fewer irritated travelers will complain, providing a better image for train operators such as NS (Nederlandse Spoorwegen) or DB (DeutscheBahn). Next to that, with a better spread of passengers, the amount of carriages of a train can be optimized/minimized, leading to lower costs for these public transport companies. In particular, the NS is trying to work on their reputation, and one of the ways they try improve it is by improving passenger comfort [6]. Because of this the NS would also profit if the passengers can sit without walking through the train.
Also in our consideration are the software and system developers. More technology in the train means that they have more work, leading to a higher revenue for these companies. Next to this, improvements on the platform also have an influence on Prorail, which manages the platforms. These platforms could be designed in a better way, leading to a higher train density at stations located in more densely populated environments.
Scenarios and personas
John: John already uses the NS app on a daily basis to find a good place to get some work done for his work. John can travel first class because his company is paying for it. He prefers to sit in the row with single seats. Since John only knows where the train stops, he frequently has to search for a 1st class carriage. When he has found one, most of the single-seaters are already occupied. John Would like to have an indication where the 1st class compartments are located, such that he has the most chance of having a proper place to sit.<br\>
Iris: Iris is a 2nd year Bachelor student that travels daily from her home in Roermond to the TU of Eindhoven. Iris always wants to find the least crowded spot in the train. The only ways of doing this now is walking through the train or using the app, which only shows the occupancy scarcely. Iris would like to have an app that always says where on the platform she has to board to have the biggest chance of a seat.<br\>
Boris: Boris is a 84 year old grandfather. Once a month he travels to his grandchildren by train since his driving license has expired. Due to his age, Boris walks really slow and therefore he sometimes has to rush if a train stops at a distance on the platform. Boris is very skeptical about having a smartphone and thus cannot use the NS app to see where the trains stops. His opinion is that information should also be available for people without a smartphone.
Sophie: Sophie is 16 years old. Each Saturday she travels by train from Geldrop to Eindhoven to go play hockey. Sophie has Protonopia (color-blindness). Therefore she can not use the app of the NS in its current state, since she cannot distinguish between the different collors used in the app. Sophie thinks that the NS should design their app in such a way that people with visual impairments can still benefit from it or at least give other alternatives.
Approach, milestones and deliverables
Approach
The problem will be divided into two subproblems. A counting system and a user interface. The counting system has to accurately count to amount of people in each compartment and compare it with the available space to get the information about the available space. For this, nowadays weighbridges are used. However, we want to provide real-time data, since there is much activity around arrival or departure in a train. The user interface has to pass the information on to the passengers in a clear and understandable way. This user interface will consist of tiles that can have different colors or an LED screen providing information. Next to the tiles at the platform, an integrated app which also will be shown inside the trains will be developed. Combining both should provide the best possible solution for the problem of overcrowded train compartments and ineffective use of space.
Milestones
The first milestone is finding out which counting technique will be used. When this is known, the basic layout for the app can be made. Also the basic layout for the physical system can get designed then. Second milestone is writing the code and checking if it works, by applying different test cases. In the meantime, the counting system can be completely designed and constructed. Merging these two systems is the next milestone. Coupling this data to NS' live data will be the last milestone.
Deliverables
The deliverables at the end of the project will be a design for a real-time system that accurately counts the amount of people in each compartment and a user interface that passes information onwards to the passengers as effectively as possible. Both parts will be combined to make a total system that gets accurate information about the occupation of each compartment and passes it onwards to the passengers through a straightforward user interface within the train, at the platform and in the app.
Questionnaire (Customer needs)
Scope of the questionnaire
To get a grip on the customer needs for the concept which helps people to board a train more uniformly, a questionnaire was made and has been distributed among a diverse group of people. The goal of the questionnaire is split in two parts. Firstly, the satisfaction of train travelers from their chance of getting a seat is monitored, as well as whether they use the current NS app to improve their chance. The second goal of this questionnaire is determining content of the improved app that the travelers want themselves.
General respondents
The majority (77%) of people travels by train with a high frequency. Only about 23% travel less frequently than once per month. Of these people, 61.5% travel outside of rush hour. Only 2 respondents out of 26 have a form of visual impairment.<br\> Only 76.7% of the respondents have the NS app downloaded on their phone. These people mainly use the app to plan a trip (80.8%), find the departure platform and time (76.9%) and to see how long the train is (46.2%). However, only 11.5% use the app to see how busy the compartments are. After this questionnaire 30.8% say that they will start to use this function when it is available.
Opinion on chance of getting a seat
Respondents evaluate their chance of getting a seat as good. 73.2% typically find a seat and are satisfied with their chance. This number is slightly lower than the number NS distributes in their yearly report about the chance of getting a seat, being 95,1% in 2018 [7]. Also, a difference between people traveling during rush hour and people traveling outside of these peak hours. The former evaluate their chance of having a seat as 3.22 out of 5, while the latter evaluate this chance at 4.33 out of 5. The satisfaction that belongs to this chance of seat is 3.44 out of 5 for rush hour and 4.33 outside rush hour (on a scale of 1 to 5 again). Crowdedness in the trains is judged neither a problem, nor a positive. However, to achieve the results that the NS is striving to, action should be taken. <br\> A general preference can be found for the specific compartment where a commuter boards the train. 88.5% mostly walk to a place with low person density at the platform to avoid a crowd gathered around the predicted stopping place. Of this majority, 53% always walk a distance to increase their chance of a seat. Of these people, 85% would even walk towards the other side of the platform, if their chance of getting a seat was(almost) guaranteed, while only about 15% would maybe do it or not at all (4.3%). This boarding behavior is the same for passengers during and outside rush hour. A minor difference of 0.08 on a scale to 10 is found.
What information do people want to know
A majority of 50% only want to know which carriage they have to board to maximize their chance of getting a seat. 38.5% want to know the approximate number of free seats. Next to free seats, travelers really (95.7%) find it convenient to know where 1st and 2nd class carriages are located. Only 15.4% want to know where they can store their bicycle and 3.8% - where they can find silent compartments. Place of the compartments where a service is provided is mostly preferred to be known (65.2%), while only 30% also want to know the exact location of that service within the carriage to find the correct door to board.
Layout and colors
If people could use two ways of obtaining the critical information, they would either prefer an app for it (61.5%), or displayed information on the train itself (50%). LED strips at the platform are chosen in 38.5% of the cases. TV screens are found as almost useless - only 19.2% would choose this method.<br\> A slight majority (53.8%) would choose colors that also suit for colorblind people. However, for distinguishing 1st and 2nd class, people respectively tend to choose red (69.2%) and blue (69.2%). Both numbers greatly outnumber the other options with a difference of over 55% in comparison with the second choices.
Conclusion and discussion
Designing a system that helps people find a better spot in the train would be perceived quite well. Especially when the trains are busy, like at the edges of rush hour, people value their chance or satisfaction of getting a seat 0.5 to 1 number lower on a scale of 5 than what they would value those criteria while traveling outside rush hour. Thus the most improvements can be made at situations where the trains are quite crowded, but not completely full.<br\> Current systems like "Zitplaatszoeker" unfortunately are quite unknown to the public. Main reasons for introducing this boarding assistance are displaying the place where different kinds of compartments (1st and 2nd class) will stop at the platform. Although colors like red, orange and green are psychologically better to use to display the crowdedness in the train, people tend to choose the colorblind alternative (working with blue- and orange- gradient colors). <br\> One interesting fact has come out of the questionnaire. It is quite interesting to see that people prefer information, like where 1st and 2nd class is located, displayed on the train itself. One of the reasons to skip this answer in the analysis is that we believe the people perceived the question wrong. Fact is that people cannot see where they have to maneuver themselves and therefore can only line up to the platform door if the train already has arrived.
Technical Content
Counting
Counting people could be done in various ways. Currently, NS already uses weighbridges [8], Amtrak and some busses in America are using treadle mats [9] and infra red beams are used in South-Africa to monitor the corrupt behavior of some bus drivers [10]. However, all these options require quite a few adaptations to the public transportation or the rail network itself and therefore can be quite expensive.
Weighbridges
The NS is currently doing a trial run with weighbridges. The weighbridges that the NS is using for the trial run were already available because of their use for freight trains. Weightbridges measure the weight of the entire trains in tons. This means that if this system would be used to calculate the amount of passengers in each compartment it would take the weight of the compartment with all the passengers and subtract the weight of the empty compartment and then round it to the nearest ton. This system has several clear downsides. It cannot distinguish between passengers that are seated and passengers that are standing in a compartment. And because the weighbridge measures the weight of the compartment to the nearest ton and it does not take into account the spread in the amount that people weigh it has a significant measuring inaccuracy of up to eighteen percent.
| Available seating (average 93 seats per compartment) | Including standing (average 146 places per compartment) | ||||||
|---|---|---|---|---|---|---|---|
| Gender | Passengers per ton | Total weight (kg) | Passengers based on mean weight | Difference to mean | Total weight (kg) | Passengers based on mean weight | Difference to mean |
| Mean | ~13 | 7161 | 93 | 0 | 11242 | 146 | 0 |
| Men | ~12 | 7812 | 85 | -8 | 12264 | 134 | -12 |
| Women | ~14 | 6510 | 102 | +9 | 10220 | 161 | +15 |
When taking into account only the seated places in the train, depending on the gender composition of the passengers, the number of people on the train can vary by seventeen. This shows that the determining the amount of people in a compartment is not accurate enough if the aim is to use the information to determine if there is a chance of finding a seat. If the system would be used to tell which compartment has the most space, so standing and seating combined, the possible measuring inaccuracy would increase to a possible difference of over twenty seven people.
Mobile phones

A more promising option would be using the location of a mobile phone of travelers. This can be done in several ways:
Bluetooth:
Bluetooth tracking systems can be used. Of all people who have a phone, about 40% have Bluetooth turned on. Therefore we could use Bluetooth-beacons to count the number of Bluetooth devices and extrapolate the data. Bluetooth beacons cost about €9 per piece and have a range of about 50 meters. According to nu.nl , the NS wants to have 4077 compartments in 2022, so installing 2 beacons per compartment would cost €81.540.
This is definitely the cheapest option, however the question is how accurate this is. Research did show that in a crowd of ~16,000 people it has an accuracy of about 17.9%, but in trains you don't work with crowds of this size. Since Bluetooth counting is less accurate than the current system using weight-bridges, we decided to shelf this idea.
Wifi: Determining the cost of a Wifi-tracking system would be a very difficult task, since we don't know what kind of hardware the NS already has for their Wifi-network. We do know however that Wifi-beacons are 4-5 times more expensive than Bluetooth beacons. Since Wifi-tracking is also less accurate than Bluetooth tracking we have discarded this method.
Bliptrack:
Bliptrack is a system combining the 2 methods above. It detects Wifi/BLE/Bluetooth-enabled devices [11]. By placing these sensors inside the compartment at critical places, such as inside the coupé and at the balcony, a proper measurement can be made of how many mobile phones are present inside the train.
With all these methods, there is a small group of people that is not accounted for in the trains: People that are not using their phone because they just don't not using it at that moment, or people that do not even have a phone. Figure 1 shows the amount of people living in the Netherlands without a phone. A questionnaire under 3000 people has showed that 87 percent of Dutch citizens are in possession of a phone. The most promising growing group consists of seniors. That group was growing by 19 percent per year in 2016, while 18-34 has grown with 3 percent and 35-54 with 7 percent. Other instances like statica find of mobile phone usage of 85 percent. Of those approximate 14.5 million people, 52 percent use their phone while using public transportation. However, there is 1 problem with this method. Usage of smartphones and therefore also Bluetooth can differ per coupé at any given time. If more younger or older people are seated in a carriage, the number of people in the carriage can get misjudged, since these people all deviate from the average users.
Other methods of counting
Cameras:
This is easy to implement and relatively cheap. However this raises privacy concern so this will not be a good solution.
Tracking OV-chipcards.
Till 2008, all OV-chipcards had an RFID-chip. Nowadays they have an NFC-chip. We cannot track people using an NFC-chip since the reach of these chips is limited to less than half a meter. However, RFID-chip can be used. RFID-chips are relatively cheap (€0.06 per piece), so we could put them back in the OV-chipcards, separate from the NFC-chip, making it such that almost all paying passengers can be tracked. The main drawback is that it would take 5 years to phase the RFID-chips in (Since that's the time an OV-chipcard is valid). The range of such a cheap chip is also only a couple of meters, requiring a lot of beacons.
Carbon Dioxide This would also be cheap to implement, as CO2 sensors cost around €90 and only one per compartment would be needed. CO2 sensors can reach a high accuracy in a closed environment for low amount of people. Accuracy for up to 4 people can reach 94%. Accuracy for more people in a small closed room will be 60%-80%. However a train is not a closed environment with doors opening and closing at each stop and ventilation systems working. So this accuracy is likely to be on the low end of the 60%-80% range. [12]
InfraRed sensors
This would be a good solution since the sensors are relatively cheap, they go from €70 per piece. With this system, each compartment would need a minimum of 4 sensors. This has to be implemented in 4077 compartments, so the materials would cost €572381 plus installation costs. Study that implemented infrared counting system in busses has shown that people did not notice the presence of the sensors and that such system gave accuracy levels around 99%. [13]. Disadvantage of such system is that each counting error will not be corrected till the end of the traject. So the longer train is active the more these small errors will add up.
Needed Data
Regardless of what counting method is used, the following few pieces of data are needed to be able to effectively determine the rate of occupancy for each compartment:
- The location of the first and second class seating areas along the train.
- The number of seats per class in each specific train compartment.
- The location of the entries to each seating area in the compartments
Other useful information to collect from each specific type of train would be:
- The location of the entries for disabled travellers and for passengers travelling with their bike.
- The location of the silent compartments.
Our solution
We chose to do the counting using infra red sensors. We chose this method because IR sensor accuracy is very good and they are pretty easy to install and much cheaper than weighbridges.

More valuable data
The data gathered from the infra red sensors is more valuable than the data from the weighbridges, because the infrared gates can distinguish between the occupancy levels of the upper and lower compartment in double decker trains. They could also distinguish between first and second class by adding one extra gate. Another advantage is that the infra red sensors can keep track of the passengers switching compartments during the trip and the weighbridges can only measure when the train is leaving the platform.
Accuracy
The accuracy of infrared counting is higher than weighbridges. On a full train weighbridges counts can vary up to 26 people per compartment, whereas infrared has an accuracy of 99% at the start of the traject and 94% near the end, because of error additions.
Costs
It is much cheaper to implement infrared gates in each train, than it is to install weighbridges on each platform in the Netherlands. See the costs section.
Downsides
This technology however has two important downsides. The first problem is that counting errors will add up during the traject, because when a person is accidentally counted twice, the compartment will keep counting one person too much until the whole counter is reset. However we do not think that this error is a lot since the accuracy of the counting is very high and we can reset the count after each traject. Also, when train personel sees that the data is not right, they could reset the count and put in the correct number. The second problem is that the infrared sensors have to be cleaned regularly for them to work optimally. This can be done during the cleaning of the train when the bins get emptied, which is done regularly enough.
Data Processing

Knowing the needed data, an overview of how the system works can be made (figure 3). At both entrances of the seating area two bidirectional infrared sensor will be placed, as well as at the door between the first and second class seating area in certain compartments. These sensors will be capable of determining if a traveller is entering or exiting the seating area of the compartment, so they detect the person presence and its direction. This means that for each compartment of the VIRM, a minimum of eight sensors will be needed at the doors to the seating area. The amount of sensors may increase if there is a first and second class compartment at the top and/ or bottom layer of the train. The total number of infrared sensors will vary per compartment from eight sensors when only second class seating is present to twelve when both first and second class seating is available at both the top and bottom level of the train compartment.
By combining the information from the infrared sensors at each end of the compartment and the sensor between first and second class, it should be possible to get an accurate number for the amount of passengers seated in each class of a compartment. This combination of infrared sensors should be capable of reliably and accurately providing information about the amount of travellers in each sitting area in real-time.
Then, the ratio of people in each compartment to the seat capacity can be mapped to colours from green to red, blue to orange, or any other combination of colours, and this would depict how full each compartment is, and the depiction would in turn be sent to the users via the app or another medium. The app will send the people to the compartment with the most chance of finding a seat. The app should also take into account the amount of people looking at the app in real-time so that it can adjust to which compartment it directs the travellers. This should make sure that not all people are sent to the same compartment, which could result in a smaller chance of getting a seat than stated in the app, but that the people looking at the app are distributed along the train so that all have an equal chance of getting a seat.
Platform indication

In 2018, the German railway operator has tested a form of "assisted" boarding in Stuttgart-Bad Cannstatt at an S-Bahn station. Information about the train is given via tiles with LEDs. Occupancy rates are just like the Netherlands estimated via load of the compartments of the train and some new methods, such as CCTV, door sensors and ticket information. The concrete slabs at the platform can provide information where the doors are located and how busy the coupés approximately are. However, there are a lot of things that can not be done yet with this system. Therefore, this part of the project will focus on improving the design of these tiles. A few requirements are set for these tiles. The tile should be able to:
- Show where the doors will be.
- Show where 1st and 2nd class is located (also top or bottom).
- Show how full the carriages are.
- Show where special carriages are located (e.g. wheelchair or bicycle).
- Show that traveler has not reached the boarding area yet.
- Show that a train cannot be boarded.
- Show that a train is about to leave.
- Be clearly visible for all people.
To make sure that all these criteria are met, the following design is presented: <br\>

The tiles should consist of at least three separate colors of LEDs: red, which can be associated with 1st class, blue, which can be associated with 2nd class and white or any other color, which indicates where the doors are located. The most convenient pattern for these platform tiles is a cross of LED diodes and two horizontal strips of LED diodes in the middle of the tile. These generic shapes make sure that all shapes can be made that are necessary. There are two possible ways for displaying where the doors will be located: LED diodes light up where doors will locate. The two horizontal lines can indicate where first and second class is located by adjusting the color. For first and second class, respectively red and blue will be used, since this matches with the customer expectation as shown in question 21 and 22 of the questionnaire. By adjusting the DPI (Dots Per Inch) of those lines, the occupancy of a carriage can be displayed, where a low DPI-concentration would stand for few places available and a continuous line means a big chance of getting a seat. By illuminating the platform in front of empty or non-busy train compartments by these continuous LED strips and only using a line with low DPI for cramped carriages that is not that striking, people's attention is pulled towards the carraiges with much space left. <br\>At the small LED screens, also additional information like wheel carriage etc. could be displayed, just like information how the system works and what all colors mean. For trains that cannot be boarded due to arrival on their final destination, all crosses could emit red light, reminding the passenger to board another train. While decoupling trains due to under-occupancy, which happens a lot at stations like Eindhoven and Amsterdam, arrows could indicate the train travelers to board the front of the train.<br\> Providing of a proper way to travel should be possible for all people. A special thought should be done for groups of minorities, such as visually impaired people like Sophie. With the colors in the app, it has already been made sure that people do not find any difficulties while "reading" the colors. However, this should also be possible for the physical system consisting of the LEDs. A balance should be found between this small groups of "vulnerable" people and the vast majority. With the current design of using blue and red, color-blind people will not have difficulties in distinguishing the colors. The reason for this is that they can see blue "in a normal way" and red is either seen "in a normal way" or as a brown-green hue.
App indication


NS has already experimented with showing train carriage capacity in their apps. However with our live and more precise counting we can make improvements on that App system. With this new information we can distinguish between the upper and lower compartment of the train and we can even distinguish between first and second class. This is especially useful when a train is very full. In this case the second class is crowded, but often there are enough seats in first class compartments. The app can show first class travelers where seats will be available.
The app displays every compartment of the train with an indication color which shows how busy it is. With this information train travelers can decide to board a carriage which is less full (see figure 6). The questionnaire showed that many people (46.2%) would prefer a coloring that goes from green (not busy) via yellow to red (very busy) over a colorblind coloring from blue to orange [14]. So we decided to make this the standard and add a setting to change the colors in the app for colorblind people.
From the questionnaire we also found out that train travelers would want to know where bike and wheelchair entrances are in the app. So we made a design to keep the app simple but also give this extra information. The design uses a toggle button for wheelchair and bike, when the user presses this button the coloring of the carriages changes to gray for unavailable or to blue for available. (see figure 7)
Lastly the app gives travelling advice to the user. For example see figure 6; "62% more chance for a seat in wagon 3". These messages will be live generated and can be personalized. Some examples of personalisation are seat allocation for people who travel first class, advice people in wheelchairs or drive with bikes only compartments that have such special entrences. Or if 40 people check the app at the same time, we could advice next users to board a different compartment, because not all users should board the same compartment.
We tested the design of the app to Users, to see if users would understand the app and be able to work with it. 8 participants agreed to test out the app, all participants were smartphone users. 5 participants were the age of 18 to 20 and considered themselves digital capable, 2 of them had never used NS-app. Two participants were in their 50s - one considered digitally capable, and the other considered less digitally capable, both had never used NS-app. The last participant was the age of 80, she considered herself less capable of using smartphones and had never used the NS-app.
For the experiment the app was set up as in the example of figure 6 and asked the participants 3 questions. First question was: "If you were waiting at this station which compartment would you board?" all participants answered wagon 3. This indicates that the boarding advice is easily readable. Second question was: "If you see a lot of people on the platform waiting in front of compartment 3, which compartment would you board? 2 participant would board wagon 4, since that was next to 3 and the app indicated that wagon 4 was medium full. the other participants would board wagon 6, since that one was almost empty. This indicates to us that the capacity display of each wagon is also pretty well readable. Last question was: "What if you were in a wheelchair? What compartment would you board?". 6 participants were able to identify that the wheelchair and the bike signs were buttons and they all decided after pressing the wheelchair button to board wagon 4. The other two participants did not recognise that they could press these buttons and would have gone to a compartment without special wheelchair space. We decided to extend the app by adding text underneath the buttons to indicate that they are pressable.
The app could be extended, by calculating estimates to predict how full a train will be at what time, so travelers can decide to take the next train or another route. These estimates can be based on previous data of the same train on the same traject and time. This way the app shows live data when available and estimated data when not available.
NS trains
Information about the composition of the VIRM that was available.

| VIRM train | Compartment 1 | Compartment 2 | Compartment 3 | Compartment 4 | Compartment 5 | Compartment 6 | Empty weight(tons) | Number of seats |
|---|---|---|---|---|---|---|---|---|
| VIRM III |
|
|
|
|
| |||
| VIRM IVa |
|
|
|
|
|
| ||
| VIRM IVb |
|
|
|
|
|
| ||
| VIRM VI |
|
|
|
|
|
|
|
|
Costs
Weighbridge
A high-quality Weighbridge can cost up to 20 thousand euros to install.
According to IndiaMart, an Indian in-motion railway weighbridge manufacturer, namely Technoweigh India, offers top-grade weighbridges at the cost of 850 thousand Indian rupees, which amounts to roughly €10752.[15]
Depending on the station, multiple would have to be installed in each station.
This means costs can exceed 100 thousand euros per station. There are a total of 408 stations in the Netherlands, with 61 of them being intercity stations[16] [17].
If we take an average of 4 weighbridges per station, the minimum cost for weighbridges would amount to 2.7 million euros for the installation alone, and some additional amount for maintenance and control.
Infrared sensors
In each carriage of a VIRM train, the plan is to install 4 bidirectional sensors (one at each end of each door to a seating area), + 1 or 2 additional sensors if the carriage is a split 1st/2nd class carriage. Bidirectional sensors are available from €220 and upwards, but, to get an upperbound on the cost, let's assume we buy them at €300.
There are 2 types of VIRM trains still in use: the VIRM 4 trains and the VIRM 6 trains.
The VIRM 4 has 4 compartements, of which 2 are split. Each VIRM 4 will need 19 sensors in total, making the cost €5700 per train (at €300 per sensor). The NS currently has 98 VIRM 4 trains, making the total cost for all VIRM 4 trains €558600
The VRIM 6 trains with 6 compartements, of which 3 are split. Each VIRM 6 will need 28 sensors in total, making the cost €8400 per train. The ns currently has 80 VIRM 6 trains, making the total cost for all VIRM 6 trains €672000.
So the total cost for the installation of all sensors would amount to €1.230.600,-
LED display tiles
LED display tiles vary in price between 50 and 200 euros, however some of the cheaper models are not sure to withstand being stepped onto. LED display tiles are usually 30x30 [18] [19] or 60x60 [20] tiles. Based on these sources, a good estimate price for a 30x30 tile would be 50 euros. Since a train compartment is 25-30 meters long, and since most train configurations include 3-6 compartments, averaging at 4-5, we could estimate 100-120 meters per train. This would mean about 300-400 tiles per train pier, and if we assume 4 piers average per station, this means about 1500 tiles per station, amounting to about 50 thousand euros per station, or 20 million euros total across all stations.
Summary
Installing infrared sensors in all VIRM trains is at least €1.469.400,- cheaper than installing weighbridges in all intercity stations. So from a financial perspective, it is more beneficial. The biggest cost in this project are definitely the LED display tiles.
Conclusions and future work
Conclusions
Due to the the difference in chance of getting a seat between the target of the NS (95%) and the outcome of the questionnaire (85%), the method of trying to divide people more evenly on a train should be improved. Detailed research has been done on the current sensing methods NS uses for determining the occupancy of carriages. The current method using weighbridges is not reliable enough and too expensive for implementing on all stations. Out of RFID, Bluetooth, WI-FI tracking, IR and other sensing methods, InfraRed sensing is found to be the most feasible solution due to its relatively low price, ethical judgement and practicality of implementation. The measuring technique does have some implications such as growing errors along the track, but these can be accounted for.<br\> The application produced can be seen as an extension of the application of the NS. People are able to understand the app for the biggest part. Therefore, only minor adjustments are necessary on the app. The LED steps are still in development phase, and can be tested at a large intercity station when the tiles are fabricated. The LED tiles however are quite expensive, so tests with these system to validate the accuracy need to be performed first before investments are made for these tiles.
Future Work
The product of this project can be further developed in the future in a few ways:
The application can be extended to take into account the number of passengers that are about to board the train, and recommend different carriages/compartments to board for separate passengers, so that there is less clustering of people in front of a few train doors. Further options for personalization can be added, such as giving the user the ability to select the colors that the app uses to display the availability of space in compartments. Next to this, it would be possible to implement more given data, such as where silence in old trains and "work-or-rest" or meeting compartments in refurbished trains are located.
The mobile application can be added as an extension of the NS app, however that would require the NS app and databases to be reconfigured to accommodate the new features. The tiles could be implemented at a big station and in addition, pilot testing can be done.
Further research and development can be conducted on alternative methods for counting passengers such as Bluetooth, Wifi, and image recognition, to make them more accessible and more accurate to the point where they can be reliably used.
Planning
| Week | What to do | By whom |
|---|---|---|
| 3 |
|
|
| 4 |
|
|
| 5 |
|
|
| 6 |
|
|
| 7 |
|
|
| 8 |
|
|
| 9 |
|
|
Who's doing what?
The problem will be split into several parts. Each group member will work on a part that best fits their skills to optimize the end results.
Raw results questionnaire
The results of the questionnaire are shown below. This quationnaire has been answered by 26 people.
- Questionaire results (click to expand figures)
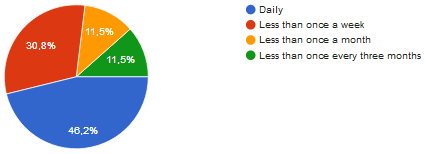
How often do you travel by train?
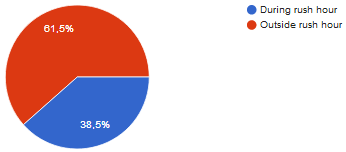
When do you travel the most by train?
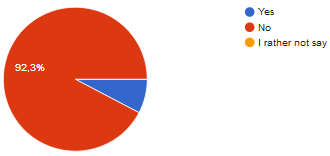
Do you have any visual impairment (partially sighted, colorblind, etc)?
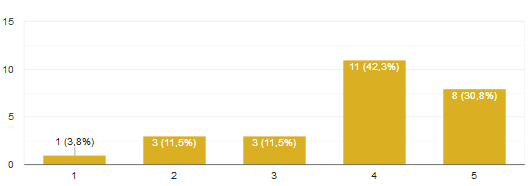
How likely are you to find a seat?
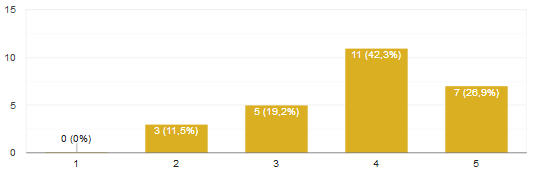
How satisfied are you with your chance of a seat?
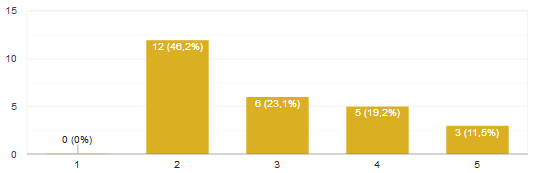
How do you assess the crowdedness in trains?
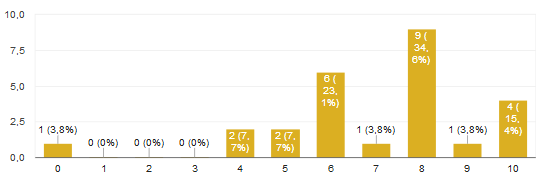
How likely will a crowd gathered around a single carriage's predicted stopping place dissuade you from attempting to go into that carriage?
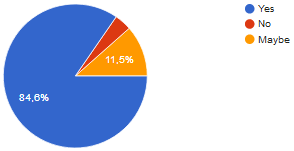
Would you consider moving to the other side of a station platform, if it were (nearly) guaranteed that you would get a seat?
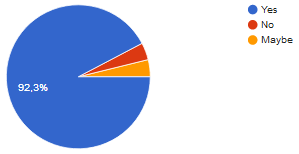
Would you consider moving approximately 75 meters, if it were (nearly) guaranteed that you would get a seat?
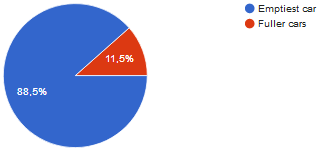
Do you reckon you would always try to go for the emptiest carriage, or would you also consider quite full carriages as well?
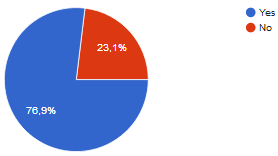
Do you have the NS app installed on your phone?
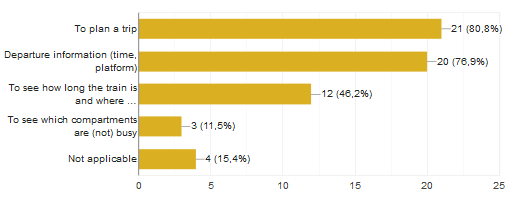
For which purposes did you ever use the NS app (so, not 9292)? Multiple answers are possible.
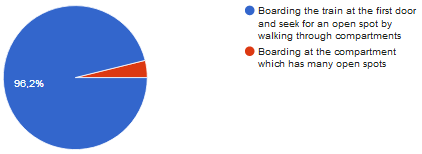
What would your behaviour be if your train leaves within a minute?
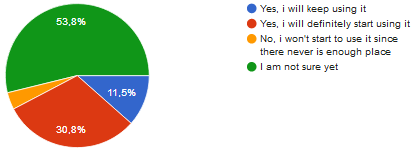
Would you use "de zitplaatszoeker" now you have seen this video?
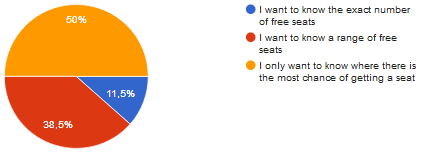
To what extend do you want to know how many seats are free in a carriage?
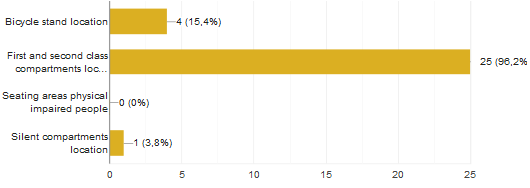
Which additional information would you like to get?
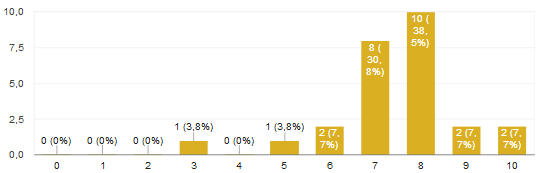
On a scale from 0-10, how useful do you think displaying where first and second class compartments are would be?
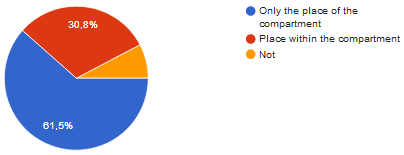
To what extend do you want to know where the first class and second class is located?
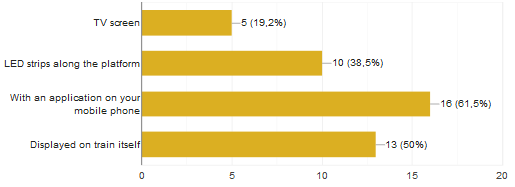
How would you like to obtain this information? Choose a maximum of 2 options.
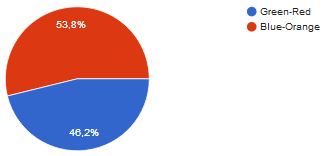
Would you prefer a green-red hue or a blue-orange (colorblind-friendly) to display how crowded a carriage is?
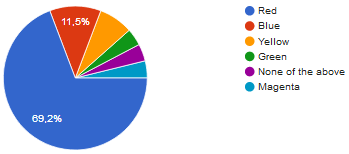
What color do you associate with first class?
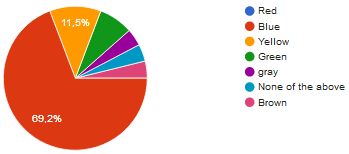
What color do you associate with second class?


Relevant (scientific) papers:
Scientific papers
1) https://www.alstom.com/our-solutions/digital-mobility/optimet-real-time-train-occupancy-smoother-passenger-flow-platforms
2) Erden, F. (2017). "A robust system for counting people using an infrared sensor and a camera". Infrared Physics & Technology, 72. Retrieved from https://www.researchgate.net/publication/280735165_A_robust_system_for_counting_people_using_an_infrared_sensor_and_a_camera
3) https://www.dilax.com/en/public-mobility/portfolio/seat-management/
4) Sojol, J.I.(2018). "Smart Bus: An Automated Passenger Counting System", ICICSA. Retrieved from https://www.researchgate.net/publication/323027620_Smart_Bus_An_Automated_Passenger_Counting_System
5) Letshwiti, V. (2004). "Appropriate technology for automatic passenger counting on public transport vehicles in South Africa", CSIR Transportek. Retrieved from https://www.google.nl/url?sa=t&rct=j&q=&esrc=s&source=web&cd=21&cad=rja&uact=8&ved=2ahUKEwiCudCpgPbhAhUJr6QKHRJQBlM4ChAWMAp6BAgIEAI&url=https%3A%2F%2Fpdfs.semanticscholar.org%2F55a0%2F9a9adb1e7905f99607846f7a286e3f39bf17.pdf&usg=AOvVaw0ZK1-RYUZ15nYZshrA0cHs
6) Gruteser, M. (2003). "Privacy-Aware Location Sensor Networks", Boulder, CO. Retrieved from https://www.usenix.org/legacy/events/hotos03/tech/full_papers/gruteser/gruteser_html/
7) Letshwiti, V. (ND). "APPROPRIATE TECHNOLOGY FOR AUTOMATIC PASSENGER COUNTING ON PUBLIC TRANSPORT VEHICLES IN SOUTH AFRICA", CSIR Transportek. Retrieved from https://www.researchgate.net/publication/267387412_APPROPRIATE_TECHNOLOGY_FOR_AUTOMATIC_PASSENGER_COUNTING_ON_PUBLIC_TRANSPORT_VEHICLES_IN_SOUTH_AFRICA <br\>
8) https://www.google.com/url?sa=t&rct=j&q=&esrc=s&source=web&cd=9&cad=rja&uact=8&ved=2ahUKEwiR9p2Uw4HiAhWNZ1AKHUeuBI4QFjAIegQIAhAC&url=http%3A%2F%2Fwww.movetec.fi%2Fimages%2Fpdf%2FTapeswitch-tuntoreunat.pdf&usg=AOvVaw0I2j-QILXPBH48Jq9N8T_d <br\>
9) http://www.instantcounting.com/technology.html
10) Ahn, J. (2017). "Estimation of Passenger Flow for Planning and Management of Railway Stations", Transportation Research Procedia, 25, (315-330). Retrtieved from https://reader.elsevier.com/reader/sd/pii/S2352146517307159?token=960AEE718A60D47CF7E7F08701AD27EDC69A9913B5CBAA27DE0D3C81DA363B16C3FF122C62F1C5A3EB601DE44AE97706
11) Nielsen, B.F. (2012). "Estimating passenger numbers in trains using existing weighing capabilities", Transportmetrica A: Transport Science, 10(6). Retrieved from https://www.tandfonline.com/doi/abs/10.1080/23249935.2013.795199?casa_token=U8PLb3o3OP8AAAAA:0a6jqeVO-6AR9W3YHihtHAag3XO5rRUyfBMkblxZQqgccoFb-AFONkHsasHFF4kCI8CDsYv7PV1B
12) Chen, T.Y. (2010). "A People Counting System Based on Face-Detection", ????. Retrieved from https://ieeexplore.ieee.org/abstract/document/5715528
13) https://www.ns.nl/reisinformatie/service-verbeteren/zitplaatszoeker.html
14) https://www-sciencedirect-com.dianus.libr.tue.nl/science/article/pii/0262885694900531
16) Bodin, W.K. (2010). "UTILIZING GROSS VEHICLE WEIGHT TO DETERMINE PASSENGER NUMBERS", ????. Retrieved from https://patents.google.com/patent/US7788063B2/en
17) Greneker III, E. (1996). "MPROVED PASSENGER COUNTER AND CLASSIFIER SYSTEM FOR TRANSIT OPERATIONS", ????. Retreived from https://trid.trb.org/view/481481
18) https://blipsystems.com/hardware-overview/
19) https://nos.nl/artikel/2271485-ns-vrije-zitplaatsen-op-meer-trajecten-in-app-te-zien.html
20) Lentz, S.F. (2010). "Platform Positioner: A Dutch Railways information service that motivates passengers to spread over the platform by providing a personal boarding advice.", ????. Retreived from https://repository.tudelft.nl/islandora/object/uuid:a67e550b-5c38-456e-9e21-90802ad36f6a?collection=education
21) Xia, W. (2015). "Semisupervised Pedestrian Counting With Temporal and Spatial Consistencies", 10.1109/TITS.2014.2371333. Retreived from https://www.researchgate.net/publication/276408492_Semisupervised_Pedestrian_Counting_With_Temporal_and_Spatial_Consistencies
22) Loukaitou-Sideris, A. (2015). "PASSENGER FLOWS IN UNDERGROUND RAILWAY STATIONS AND PLATFORMS",10.3141/2216-13. Retreived from https://www.its.ucla.edu/wp-content/uploads/sites/6/2015/11/passenger-flows-in-underground-railways-stations-platform.pdf
23) Bosina, E. (2017). "Pedestrian flows on railway platforms", ????. Retreived from http://www.strc.ch/2017/Bosina_EtAl.pdf
24) Rüger, B. (2018). "HOW PLATFORM INFRASTRUCTURE INFLUENCES PASSENGER BEHAVIOUR", 10.7708/ijtte.2018.8(4).04. Retreived from http://ijtte.com/uploads/2018-12-08/b2ddb9bc-d1c1-4333ijtte.2018.8(4).04.pdf
25) https://www.deutschebahn.com/en/Digitalization/DB_Digital/productworld/Luminous_Plazfrom_en-1214708
26) Szplett, D. (1984). "An investigation of passenger interchange and train standing time at LRT stations: (i) Alighting, boarding and platform distribution of passengers", https://doi.org/10.1002/atr.5670180102 . Retreived from https://onlinelibrary.wiley.com/doi/abs/10.1002/atr.5670180102
27) Danielis, P. (2017). "UrbanCount: Mobile crowd counting in urban environments", 10.1109/IEMCON.2017.8117189. Retreived from https://ieeexplore.ieee.org/stamp/stamp.jsp?tp=&arnumber=8117189
28) Versichele,M. (2012). "Mobile Mapping of Sporting Event Spectators Using Bluetooth Sensors: Tour of Flanders 2011", https://doi.org/10.3390/s121014196. Retreived from https://www.mdpi.com/1424-8220/12/10/14196
29) Ramaer, J. (2017). "NS werkt hard aan zijn reputatie – maar er zijn weinig organisaties waar Nederlanders zo graag op afgeven". Retreived from https://www.businessinsider.nl/ns-werkt-hard-aan-zijn-reputatie-maar-er-zijn-weinig-organisaties-waar-nederlanders-zo-graag-afgeven/ (Dutch)
30) https://www.nsjaarverslag.nl/jaarverslag-2018/a1221_2018-in-een-notendop?fbclid=IwAR34aVXU49RdKT8YdpGI7_8ymAgmWHmFs7RtBYG2P7nnAqPpm1D1tYCezJY
Categorize
Counting people:
1,2,3,4,7,8,9,11,12,14,17,18,21
Application itself:
4, 19, 25
Walking behaviour at platform:<br\>
10,20,22, 23, 24
1:
Alstom is a company that provided sensors tecnology (passive IR) to count people boarding and deboarding. At the platform, LED's show which compartments are full and which are not. With colors they influence people where they board. THe system is modular and can therefore be placed at any station of any length.
2:
pyro-electric infrared (PIR) sensor and a camera (2). Two possible ways: detection-based and map-based methods. Latter option more precise in counting (10,11). Differential PIR sensors used, since this is only possibility for differentiate between entry and exit of an environment and ordinary activities in that area by analyzing body movement. A couple of modules are used that consist of multiple PIR sensors. This data is collected and are input for a list of classifiers. Wavelet transform is used to create output signal. Using only camera yields ~ 80% efficiency, while integrating PIR has ~ 100% efficiency (Tutorial: https://www.youtube.com/watch?v=6Fdrr_1guok ).<br\>
3:<br\>
DILAX' active infrared sensors are capable of detecting people entering a door. The system is only active while doors are open. Each DILAX LAN can operate 382 sensors. The system is capable of counting in dense popluated areas with a high accuracy.
4:
Also, a pressure sensor could be used. Pressure sensors behaves like a open-closed circuit which delivers voltage while closed that can be placed underneath the padding of the seat. The Voltage is converted from a real output to a binary output which is created by Arduino. The application can read the amount of 0's and 1's and can convert that into images. The used pressure pad detects weight from 20 kg and higher.<br\>
7: <br\>
Next to PIR, infrared beams could be used that detect when interrupted. Can be either active or passive: Passive sensors sense IRradiation and with that can find moveing direction, active sensors actually can locate the person. Ultrasonic sensor works approxiametly the same way. Test in South Africa: 28000 Rand (1866 euros) per bus with 1 sensor per door. This gives an accuracy level of 95%, while 3 sensors per door give 99%. Other methods are also given in this article, giving treadle mats, IR again, load cell and normal camera.<br\>
8: <br\>
Tapeswitch is a company that produces copyright public transport equipment. Among those also belongs the treadle mat which already are in use at Amtrak trains, Copenhagen and melbourne. These mats commenly are produced with multiple zones that have different functionalities: Opening and closing a door or actions such as counting passengers. <br\>
9: <br\>
Instant counting is a company that provided treadle mats with the provided software. This software is capable of detecting the movement of a person when boarding/deboarding. It is possible to link 90 of these mats to eachother in one system. An interface shows the amount of people entering and the amount of people exiting. The system can detect direction of walking and can track different people simmultaniously.
10:
Maybe not directly relevant, but we could take into account how people walk accros the station to the destinated train to improve user experience (USE-aspects).
11:
A system that estimated the number of passengers using the weight of the train. This has the huge advantage that errors in measurement do not propagate (ex: if you use an infraredsensor and you miss one passenger leaving, the system will always keep counting one too many. Weightsensors don't have this issue).
See 13 (<- not an article), appearantly, the ns is already doing this, so we need to expand on this idea.
Appearantly, this idea has been pattented (see 16).
12:
Using face recognition. Might be a bit overkill to install an entire camera for this one purpose, and might give some privacy issues, but seems straigforward.
14:<br\>
Counting with IR can sometimes give difficulties in dense areas. Image sequence processing does not. Divided into two parts: Target detection and target validation and direction-estimation. This way, the algorithm is rather fast. The system is more accurate and still fast in dense areas.
17:
A study on how to interpret data from multiple pressure sensors (a "pressure mat").
18:
This company counts the ammount of people going in or out a door using sensors that track WiFi/BLE/Bluetooth-enabled devices. When someone walks past this sensor with his mobile phone he wil get counted and tracked with a user ID. When he later leaves the door, the count will go down again.
19:
NS launches an app, that helps find passangers train seating, by putting weight sensors in the tracks, which measure the weight distribution of each carriage.
20:
Research from TU Delft about spreading passangers over the platform. Giving crowdness information did not lead to much more spreading. Giving passengers personal boarding advice has better results.
21:<br\>
Available techniques of APC suffer from using sequences of seperate frames, where much energy is being lost. To address this issue, this paper proposes a
semisupervised methodology to extract temporal consistency in a continuous sequence of unlabeled frames. The experimental results show that this is more robust and does not require much training data.
22:
This study examines the planning and analysis of station passenger queuing and flows to offer rail
transit station designers and transit system operators guidance on how to best accommodate and manage their rail passengers.
23:
Study of passanger flows, with hypothesis about passanger behaviour. They study the important factors for stations getting more crowded.
24:
Analysis on how passengers distribute along the platform.
25:
Application of a luminous platform in Stuttgart-Bad Cannstatt station.
27:
Bluetooth counting in a city.
29:
About the reputation of the ns.