PRE2016 2 Groep1

From Control Systems Technology Group
Revision as of 11:15, 5 December 2016 by S121058 (talk | contribs) (→‎Week 4)
Jump to navigation Jump to search

PRE2016 Q2 Group 1 - Main page


Koen Damen - 0893034
Stijn de Milliano - 0816573
Ralf Reinartz - 0892456
Zjeraar Scharis - 0651925
Stefan Thijssen - 0888708
Peter Visser - 0877628


Welcome


Welcome to the Wiki of the first and only group of Project Robots Everywhere 2016 Quarter 2. On this page we will keep track of our progress during the project, this way everybody can see the progress we are making and we can organize the information we have gathered. Feel free to take a look around. We have divided our progress into the separate weeks we worked on the project explaining for each week what we did, what results we got and what we plan to do with those results. Included on the bottom of each week are also the notes of our meetings in order to be able to review those.


You can click the following link for more background information on the course and the project. [1] This link leads to the studieguide that was placed on oase.

Week 1

The goal of the first week was to decide on a subject for our project and what we were planning to do with this. This started on Monday with the first lecture, where we got more information about the course itself. After this we started brainstorming about different possible ideas to look into. A few examples of the things we looked at were space-exploration, robotic prosthetic and automating hazardous professions like firefighting. In the end we decided on swarm technology. We did still have to specify this so after the meeting we individually looked into some different applications of swarm technology. In the second meeting (17-11) we decided on a final subject: using swarm technology to observe the environment, focused on water like harbors and rivers. Here we want to test the quality of the water by looking at Chemicals, temperature, pH and metals. We decided on making a simulation of the system which can eventually be expanded. The next step was to figure out exactly what we need to make the simulation as realistic as possible, the USE-aspects and how we are going to approach the goal we set for ourselves. Our next meeting (19-11) was focused on combining the results we made throughout the week into a presentation that was to be given the following monday.

File:Presentation week1.pdf

File:Notulen 17-11.pdf

File:Notulen 19-11.pdf

Week 2

In week 2 we were trying to do 2 major things. First off, after receiving feedback on our presentation on Monday, we made contact with multiple organisations involved with the sanitation of water. We had contact with the sea harbor police, Greenpeace, Stichting-Noordzee and Rijkswaterstaat. A lot of these organisations could not give a specific answer to what problems our system should solve, since they always first encounter the problem which they then start solving. In the end the sea harbor police said they had a lot of trouble with drifting pieces of wood, since this can obstruct or even pierce their boats. Using this we changed the concept of our design to a point where the swarm should be able to find driftwood and push it to a place where it is not a problem (along with the previously defined tasks). This will give the system a specific user.
File:Notes 24-11.pdf

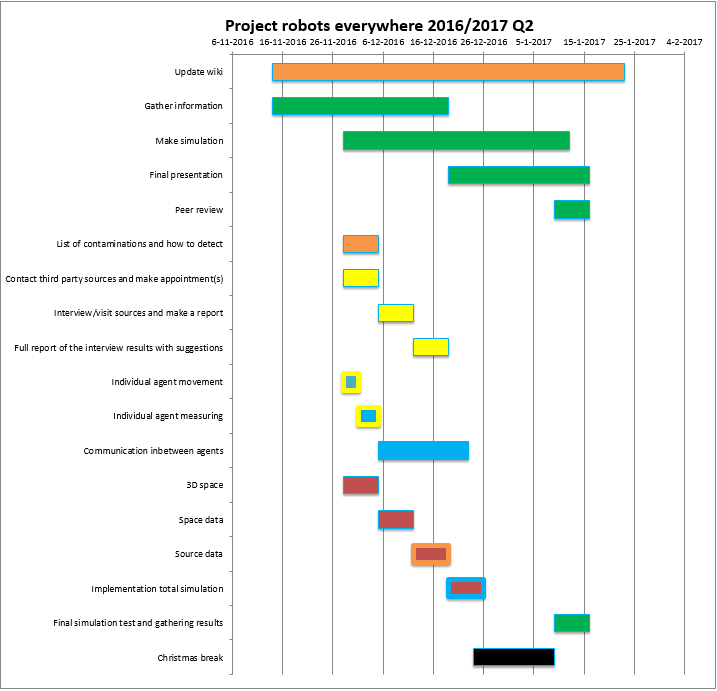
After this was done we started defining our tasks for the rest of the project. For this an initial Gantt-chart was already made in the first halve of the week. In the second meeting this week we distributed tasks which we then made individual gantt-charts for. In the third meeting we combined these to make one final charts which is to be presented in our second presentation. In this chart can be found who does what, when and with who they will be working together.
File:Notes 27-11.pdf

This same Gantt-chart is placed here on the right. In this chart every group/task has a different colour for clarity.
Green = everybody
Orange = Stijn
Yellow = Ralf
Blue = Stefan & Peter
Red = Koen & Zjeraar

Ganttchart.png

Week 3

In week 3 every group started with their individual tasks (as described by the Gantt-chart in week 2). A complete list was made of the different contaminants we would like to investigate and how to do this using different sensors and how they could be applied. For the simulating of the swarm the Matlab application 'Multi-robot simulation' is investigated to check its functions and compatibility with our project. If these results are positive this program can be used to design our system. For the environment a map was made using a picture of the harbor of Rotterdam. A software was used to convert this into a black and white map we can use for our simulation. The resolution of this map is going to be enhanced by reducing the size of the map we use. Our contact with the external companies has not yet given results, since these contacts had either no time or did not respond at all.

File:Notes 1-12.pdf

This link standing below is a link to our Dropbox files for this week. [[2]]

Week 4

This link standing below is a link to our Dropbox files for this week. [[3]]