Frequency Response Function Plotting: Difference between revisions
Jump to navigation
Jump to search
No edit summary |
No edit summary |
||
| Line 3: | Line 3: | ||
;Files: | ;Files: | ||
[[File: Frf.zip]],containing | |||
* frf.m | |||
[[File: Frf. | * frfmag.m | ||
* frfphase.m | |||
* frfhold.m | |||
* frflabel.m | |||
| Line 14: | Line 17: | ||
* Adjustable linewidth and marker size | * Adjustable linewidth and marker size | ||
* Easy to adjust limits | * Easy to adjust limits | ||
* Plot only magnitude or phase using the frfmag() and frfphase() functions | |||
Usage: frf(sys1,'color/linetype/linewidth/marker/markersize',sys2,'color/linetype/linewidth/marker/markersize',... | Usage: frf(sys1,'color/linetype/linewidth/marker/markersize',sys2,'color/linetype/linewidth/marker/markersize',... | ||
Latest revision as of 15:46, 15 October 2013
- Files
File:Frf.zip,containing
- frf.m
- frfmag.m
- frfphase.m
- frfhold.m
- frflabel.m
- Description
- Plot Frequency Response Function with
- Correct label sizes
- Optimized for MIMO systems
- Enable use of custom colors (lightgrey, darkgrey, pink, etc.)
- Adjustable linewidth and marker size
- Easy to adjust limits
- Plot only magnitude or phase using the frfmag() and frfphase() functions
  Usage:   frf(sys1,'color/linetype/linewidth/marker/markersize',sys2,'color/linetype/linewidth/marker/markersize',...
           ...{fmin,fmax,magmin,magmax,phasemin,phasemax,wraponoff,type})
  Inputs:  You can use custom colors, e.g. lightgrey, pink, etc. (see line ~315)
           To use the . marker give \. as marker (to distinguist from dots in linewidth specs)
           example strings: 'lightgrey--1.5o12'    lightgrey dashed line with circle marker of size 12
                            'orange\.'             orange solid line, dot marker
                            'b*10'                 blue markers size 10, no line
           All elements in the options-struct are optional
           fmin/fmax in Hz
           magmin/magmax in dB
           phasemin/phasemax in degrees
           wraponoff: [ 'on' | 'off' (default) ]
           type: [ 'mag' | 'phase' | 'magphase' (default) ]
  Outputs: Plots the frf in the current figure.
           Note that the xticklabels might overlap the xlabel in the
           figure. In an exported pdf file they will be correct.
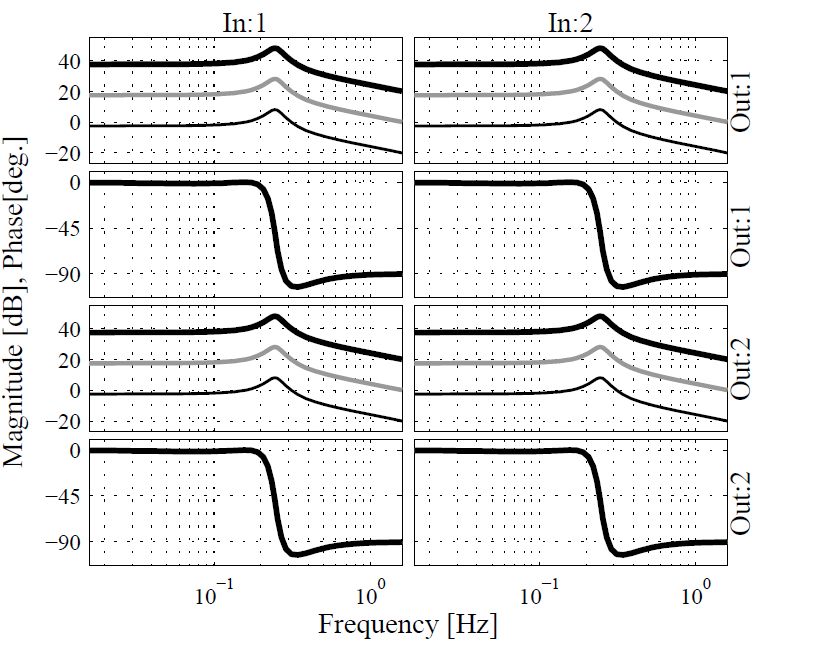
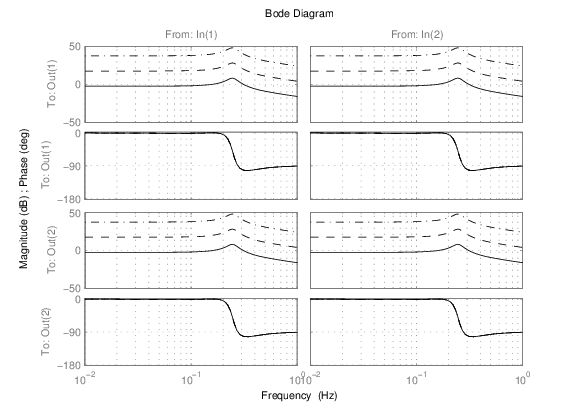
- Example frf.m vs bode.m
The size of these example pictures is such that they would fit in a two column formatted page, as in journal and conference papers.

frf.m

bode.m
- Author
- Rob Hoogendijk