Why is there need for an automated mobility scooter
Traffic related deaths
In the period of 2010-2016 the average number of traffic related deaths in the Netherlands per year is 650, of which 30 mobility scooter drivers. This is a 4.7% of the traffic related deaths. Compared to the average of 184 cyclist that died pear year in this period of time, which is 28% of traffic related deaths, this seems like a low number. But the fact is that 84% the Dutch own a bicycle, which means that there are at least 13 million cyclist in the Netherlands (using 16 million inhabitants). This while there are less than 400 thousand mobility scooters. Which translates to more than 0.0075% of the mobility scooters having fatal accidents, while less than 0.0014% of the cyclists have fatal accidents. Which means a mobility scooter driver is at least 5 time more likely to die in a traffic related accident than a cyclist.
Elderly in mobility scooters
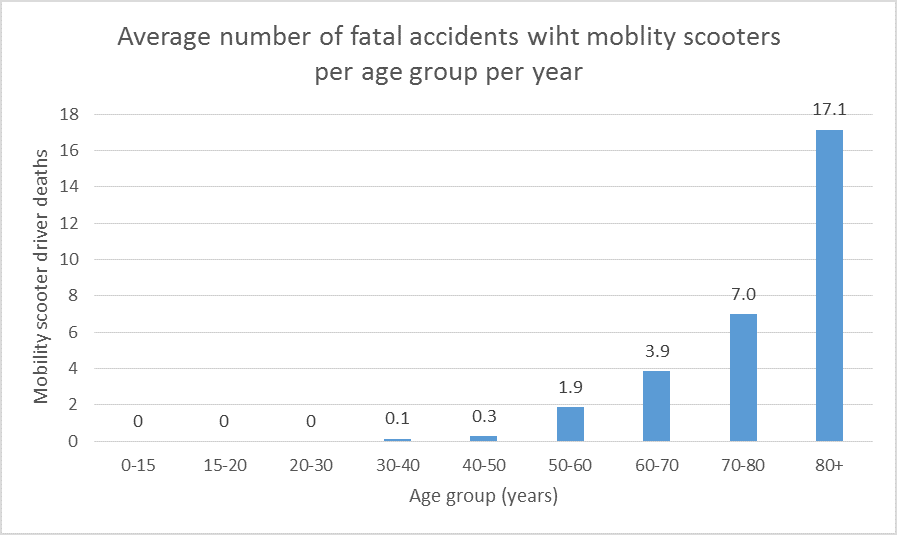
This bar chart shows the average number of accidents in which the mobility scooter driver died in the period of 2010-2016.
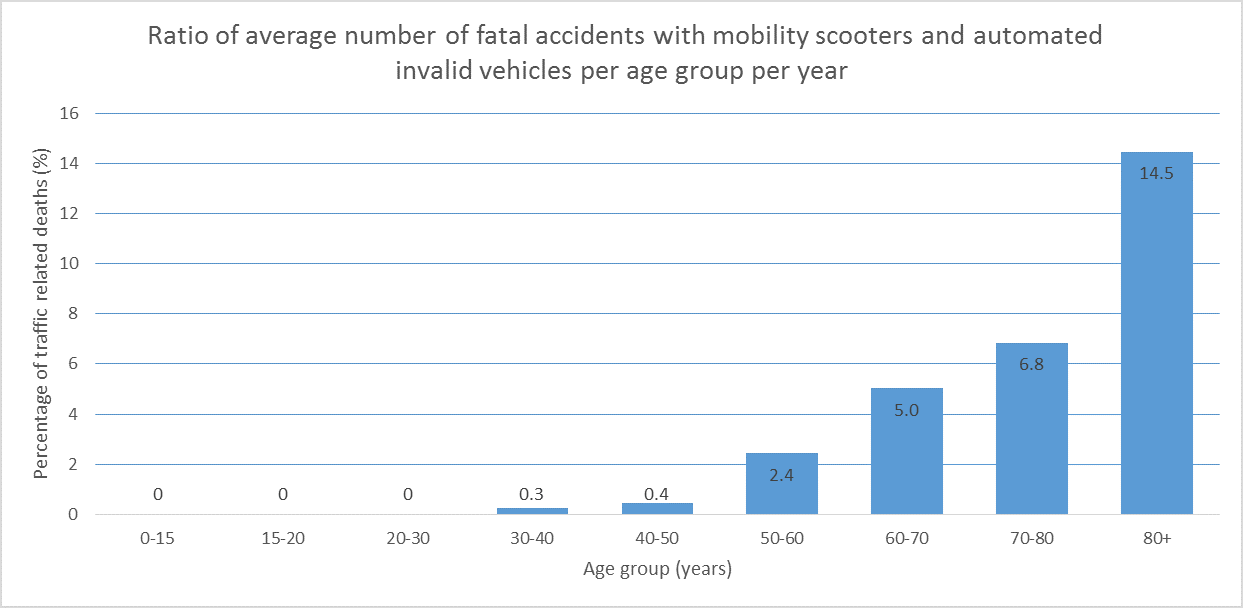
This bar chart shows the percentage of traffic related death of which the person was a mobility scooter driver in period of 2010-2016.
(Personal note: It is important to note that the older a person is, the more likely they are to be driving in mobility scooter. This should have an effect on the number of related deaths of a mobility scooter driver)
It could be assumed that the rise in the amount of deaths for the age group of 70+ is caused because this age group is more likely to drive in a mobility scooter. But as seen in this table, they are more likely to die in any related traffic accident. Source for all these statistics: Statline CBS

