PRE2015 3 Groep2 week4: Difference between revisions
| Line 20: | Line 20: | ||
| 12 min | | 12 min | ||
| (in theory) | | (in theory) | ||
| | | | ||
|- | |- | ||
! Charging time: | ! Charging time: | ||
| Line 27: | Line 27: | ||
! Interfaces: | ! Interfaces: | ||
| USB and Wi-Fi | | USB and Wi-Fi | ||
| | | | ||
|} | |} | ||
Revision as of 15:50, 4 March 2016
Approaching Users
Multiple factors can play a role for users to feel safe and comfortable with the drone approaching them. Little research has been done regarding approaching people in a user friendly way, as can be seen in the chapter Research from week 3. In order to be able to construct constrains and preferences for the approaching, four variables have been devised:
- Variable 1: Flying speed
- Variable 2: Approaching height
- Variable 3: Landing distance
- Variable 4: Flying path
The first two variables are technical constraints and thus attached to the approach. Variables 3 and 4 are coming from 2 experiments where values are computed for the optimal landing distance (relative to the user) and for a preferred flying path when approaching the user. These variables can be defined for only one drone, because users experience different drones with different feelings. For example, the size of the drone is very important for how close people want the drone to land. The drone that is used for the approaching users in this paper is the Parrot AR.Drone 2.0 is a remote controlled flying quadcopter. It was designed to be controlled by mobile or tablet with operating systems such as iOS or Android.[1]
| Dimensions: | 451x451 | (517x517 with Indoor Hull) | |
|---|---|---|---|
| Weight: | 380 g | (420 g with Indoor Hull) | |
| Battery life: | 12 min | (in theory) | |
| Charging time: | 60 to 90 minutes | ||
| Interfaces: | USB and Wi-Fi |
The drone comes with a frontal HD camera (720p, 30FPS) and a QVGA bottom camera (480p, 60FPS), both with the possibility of direct streaming. The height of the drone is measured with onboard ultrasound sensors.
Flying speed
The flying speed of the drone is important for approaching people. If the drone flies to hard, people can get afraid but if it flies to slow it would take to long. Humans average walking speed is researched to be 1.4 m/s second[2], and it is assumed that it is the right speed to test with. For safety and the accuracy reasons of the experiments however, the speed of the drone has been set slightly lower; approx v = 1 m/s.
Approaching height
For the approaching height, a height of 1 meter is chosen. This is because of the following: Lower heights would result in issues with obstacle avoidance, whereas higher heights might pose danger for the user. Eye-height of possible users might vary from 1.50 m to 2.20 m[3], making this domain unsuitable for flight. Given the accuracy of the drone for keeping the height another 0.5 meter is implemented as safety feature.
Experiment 1: Landing distance
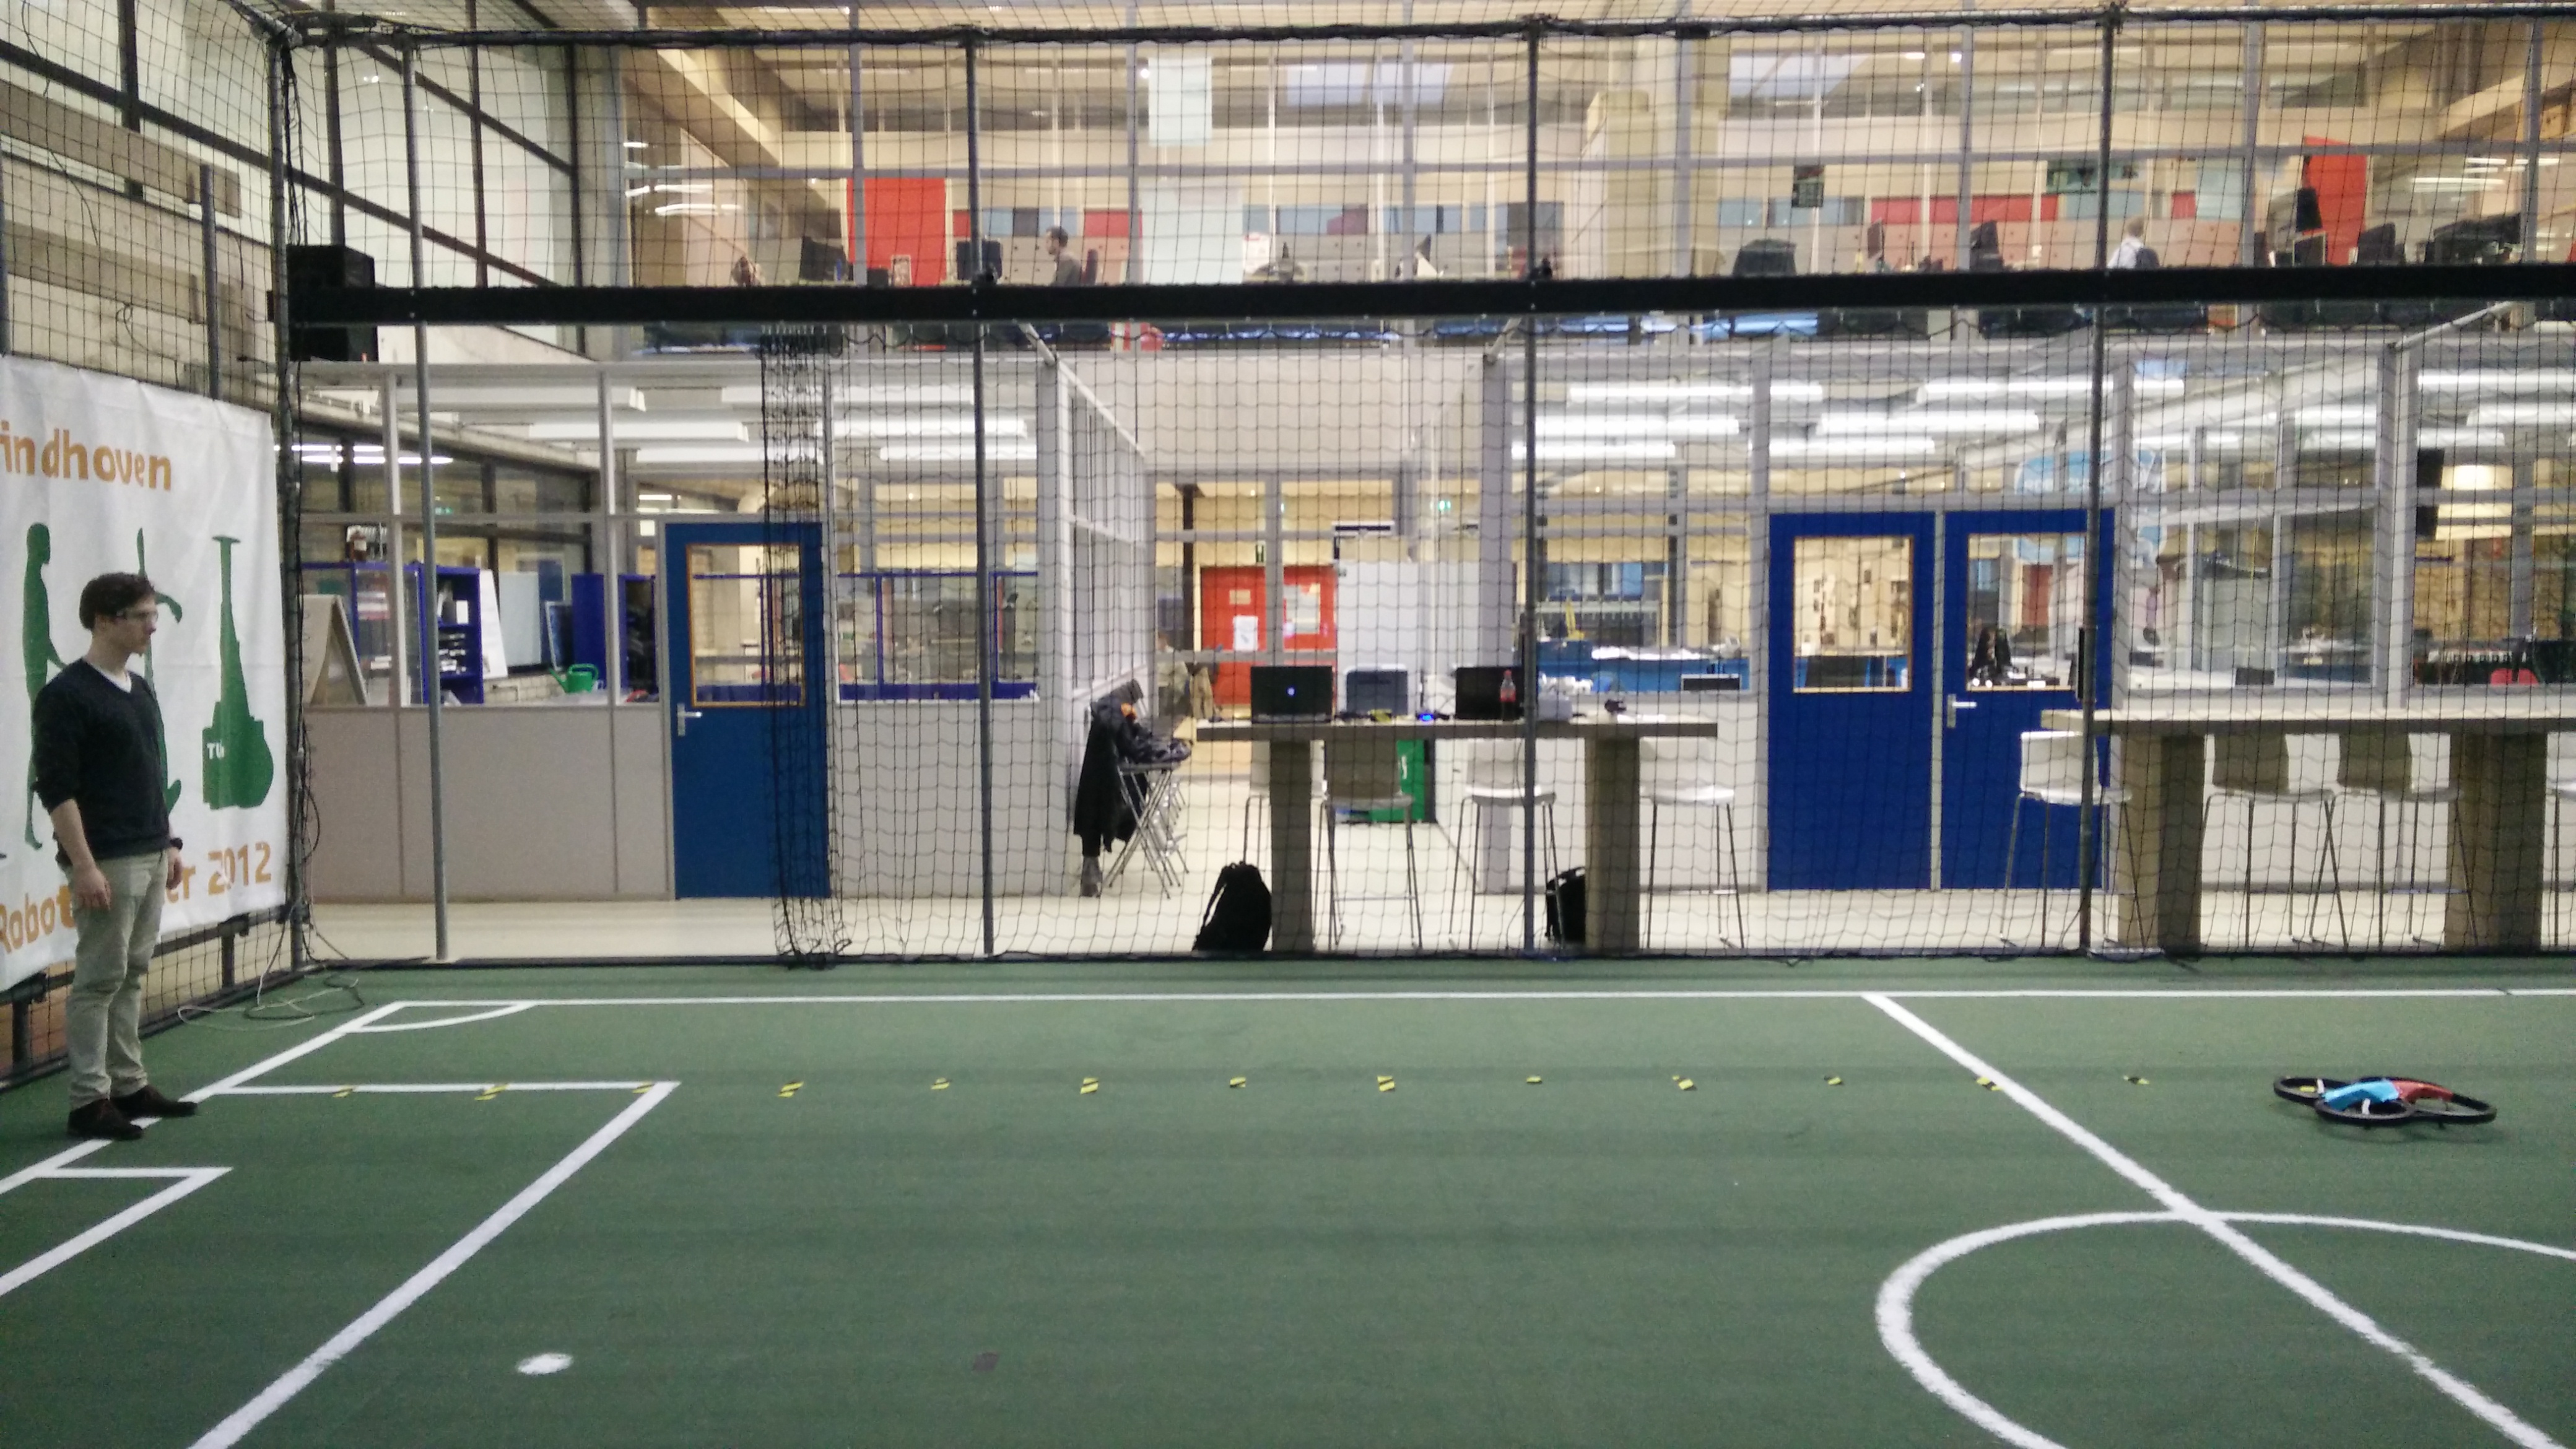
The variable landing distance is about the distance that users are still comfortable with the drone around. The optimal distance that users like and the nearest distance that people are comfortable with drones around are determined with an experiment. The subject (an user) stands on a given spot (l=0). The distances 1, 2, 3…7 meters are marked with masking tape (distance to test subject) on the ground. The drone will start at a distance of 7 meters (= lstart) as seen in figure 1. The drone will approach the person at a steady speed of approximately v = 1 m/s. It does so at a height of h = 1 meter. Whenever the test subject feels like the current distance between him and the drone is the most comfortable distance to land, the test subject will give off a sign and the drone will be given the order to land (lend). The subject will redo the test to determine the nearest distance where he or she feels comfortable. Those distances are measured and rounded per 0.25m. The results are seen below.
| Experiment | Optimal distance (m) | Nearest distance (m) |
|---|---|---|
| 1 | 2.25 | 1.0 |
| 2 | 2.75 | 0.75 |
| 3 | 2.5 | 1.0 |
| 4 | 2.25 | 0.75 |
| 5 | 2.0 | 0.75 |
| 6 | 1.75 | 0.5 |
The mean value of the optimal distance is 1.88m with an standard deviation of 0.86. The nearest distance has a mean of 0.79m with an standard deviation of 0.19m. These means give the landing distance from this experiment, the optimal landing distance is 1.90m with a nearest landing distance of 0.8m. The drone should be programmed to keep these distances as first option and starting point of the landing procedure.
Experiment 2: Way of approach
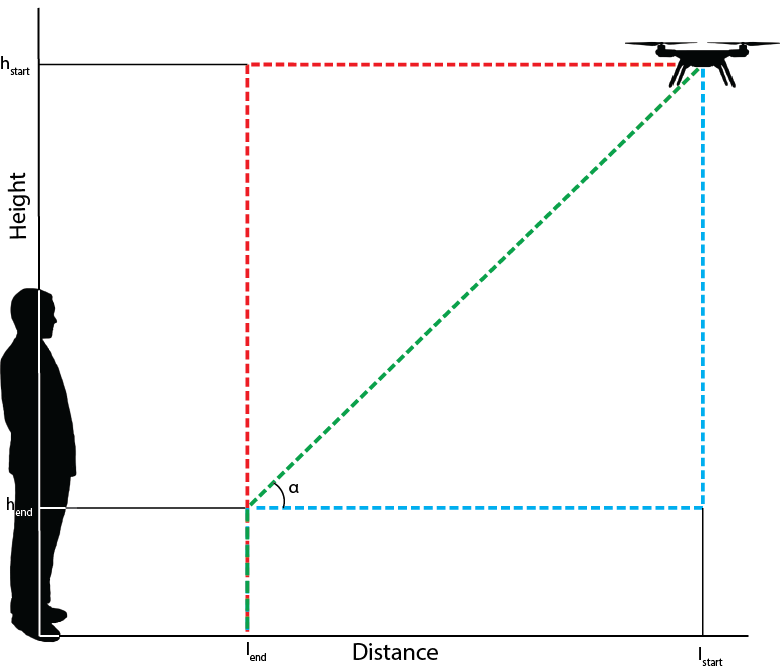
It's not online interesting to look at the best landing distance, but also at the way the drone approaches the user. A distinction is made between three different situations. For a description of these situation see the list below and figure 1. In all the situations the test person is positioned at l = 0. The drone starts at a distance lstart and height hstart.
- Situation A
- The drone flies horizontally to a certain distance lend then the drone lands vertically.
- Situation B
- The drone flies diagonally, at an angle α, to a certain point at distance lend and height hend. Then the drone lands vertically.
- Situation C
- The drones lowers itself vertically to a certain height hend. It then flies horizontally to a certain distance lend before it lands vertically on the ground.
During the experiment the three situation will get different values for the distance lstart and lend. These distances will be 6, 4 and 2 meters. Note that the drone will never fly away from the test person. So when the distance lstart equals 4 meters, only the values of 4 and 2 meter will be used for lend.
After each test variation the test person is asked to rate the experience with the values very bad/bad/neutral/good/very good.
References
- ↑ Parrot AR.Drone Specifications
- ↑ British Heart Foundation, Walks and treks FAQs
- ↑ Variation in Eye height, Ergonomics Data & Mounting Heights

