Football Table Simulation Visualization Tool: Difference between revisions
| Line 19: | Line 19: | ||
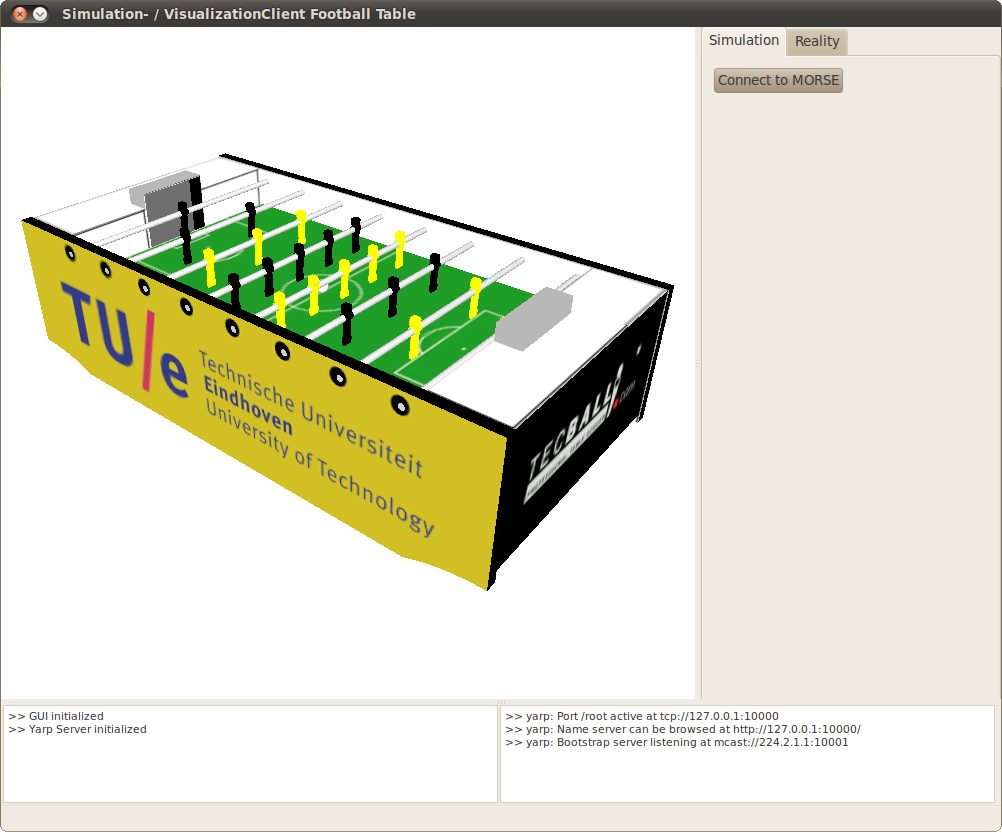
The GUI is created with use of two main elements: [http://qt.nokia.com/products/ QT] (UI Framework) and [http://www.ogre3d.org/ OGRE] (3D Graphics Engine). With use of the visualization, the user can see what information the robot obtains during a work-out. This part of the GUI visualizes the sensor data that comes from the real table or simulator. Updating this visualization and receiving data is done at a frequency of 50 hertz. This provides a smooth playback of the sensor data of the (simulated) robot to the user. | The GUI is created with use of two main elements: [http://qt.nokia.com/products/ QT] (UI Framework) and [http://www.ogre3d.org/ OGRE] (3D Graphics Engine). With use of the visualization, the user can see what information the robot obtains during a work-out. This part of the GUI visualizes the sensor data that comes from the real table or simulator. Updating this visualization and receiving data is done at a frequency of 50 hertz. This provides a smooth playback of the sensor data of the (simulated) robot to the user. | ||
[[Image:gui.png|400px|thumb|center|Figure 2: Tool Overview]] | [[Image:gui.png|400px|thumb|center|Figure 2: Tool Overview]] | ||
Revision as of 10:32, 10 September 2013
Author: Rein Appeldoorn
Information
Gazebo
A simulator is developed to easily test new algorithms without depending on the actual robot. In has been developed using gazebo (w/o the use of ROS), a so-called physics abstraction layer, which employs ODE combined with OGRE for rendering. The environment/robots are described in the SDF format, which in this case is combined with Collada (*.dae) renderings for more complex geometry. A previous attempt was created using MORSE, however this did not allow good tuning of the physics.
Inter-process Communication
This simulation communicates with Matlab Simulink using Interprocess Communication (IPC) wrapper library for the POSIX libraries. This library uses mutexes and condition variables enabling a thread-safe, synchronized, causal communication between two processes e.g. Gazebo and Simulink. This allows us to use the Gazebo simulator as a plant in our simulink control loop. More on this library and how it is used, can be found here *EDIT*.
External Documentation
- Report: Development of a Simulation and Visualization Tool for an Autonomous Football Table - Rein Appeldoorn
- MORSE Installation Guide with Yarp support - Ubuntu 10.04 LTS x86
Graphical User Interface
The GUI is created with use of two main elements: QT (UI Framework) and OGRE (3D Graphics Engine). With use of the visualization, the user can see what information the robot obtains during a work-out. This part of the GUI visualizes the sensor data that comes from the real table or simulator. Updating this visualization and receiving data is done at a frequency of 50 hertz. This provides a smooth playback of the sensor data of the (simulated) robot to the user.
