File:Emc2016 group7 gm1.png: Difference between revisions
Jump to navigation
Jump to search
No edit summary |
No edit summary |
||
| Line 1: | Line 1: | ||
Global mapping visualized in maze design of 2015. The blue point is where PICO starts, the black points is the path PICO has driven, the red points is the mapping | |||
Latest revision as of 12:29, 16 June 2016
Global mapping visualized in maze design of 2015. The blue point is where PICO starts, the black points is the path PICO has driven, the red points is the mapping
File history
Click on a date/time to view the file as it appeared at that time.
| Date/Time | Thumbnail | Dimensions | User | Comment | |
|---|---|---|---|---|---|
| current | 11:49, 16 June 2016 | 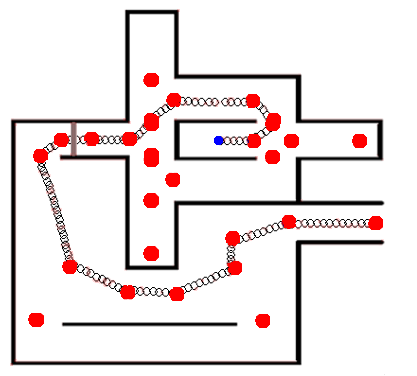 | 417 × 376 (24 KB) | S121072 (talk | contribs) |
You cannot overwrite this file.
File usage
The following page uses this file: