File:0lauk0 2018 Q1G2 exp hor loc graph.png
Jump to navigation
Jump to search

No higher resolution available.
0lauk0_2018_Q1G2_exp_hor_loc_graph.png (605 × 440 pixels, file size: 22 KB, MIME type: image/png)
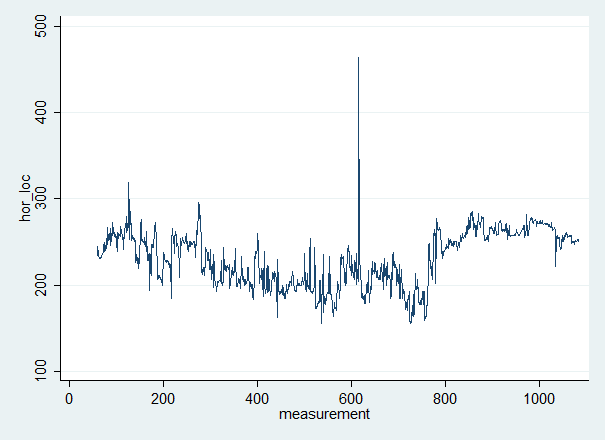
graph of experiment variable; generated using Stata
File history
Click on a date/time to view the file as it appeared at that time.
| Date/Time | Thumbnail | Dimensions | User | Comment | |
|---|---|---|---|---|---|
| current | 23:27, 29 October 2018 | | 605 × 440 (22 KB) | S141153 (talk | contribs) | graph of experiment variable; generated using Stata |
You cannot overwrite this file.
File usage
The following page uses this file: